Day 4
고급 시각화와
대시보드의 설계
고급 시각화와
대시보드의 설계
2024-08-08
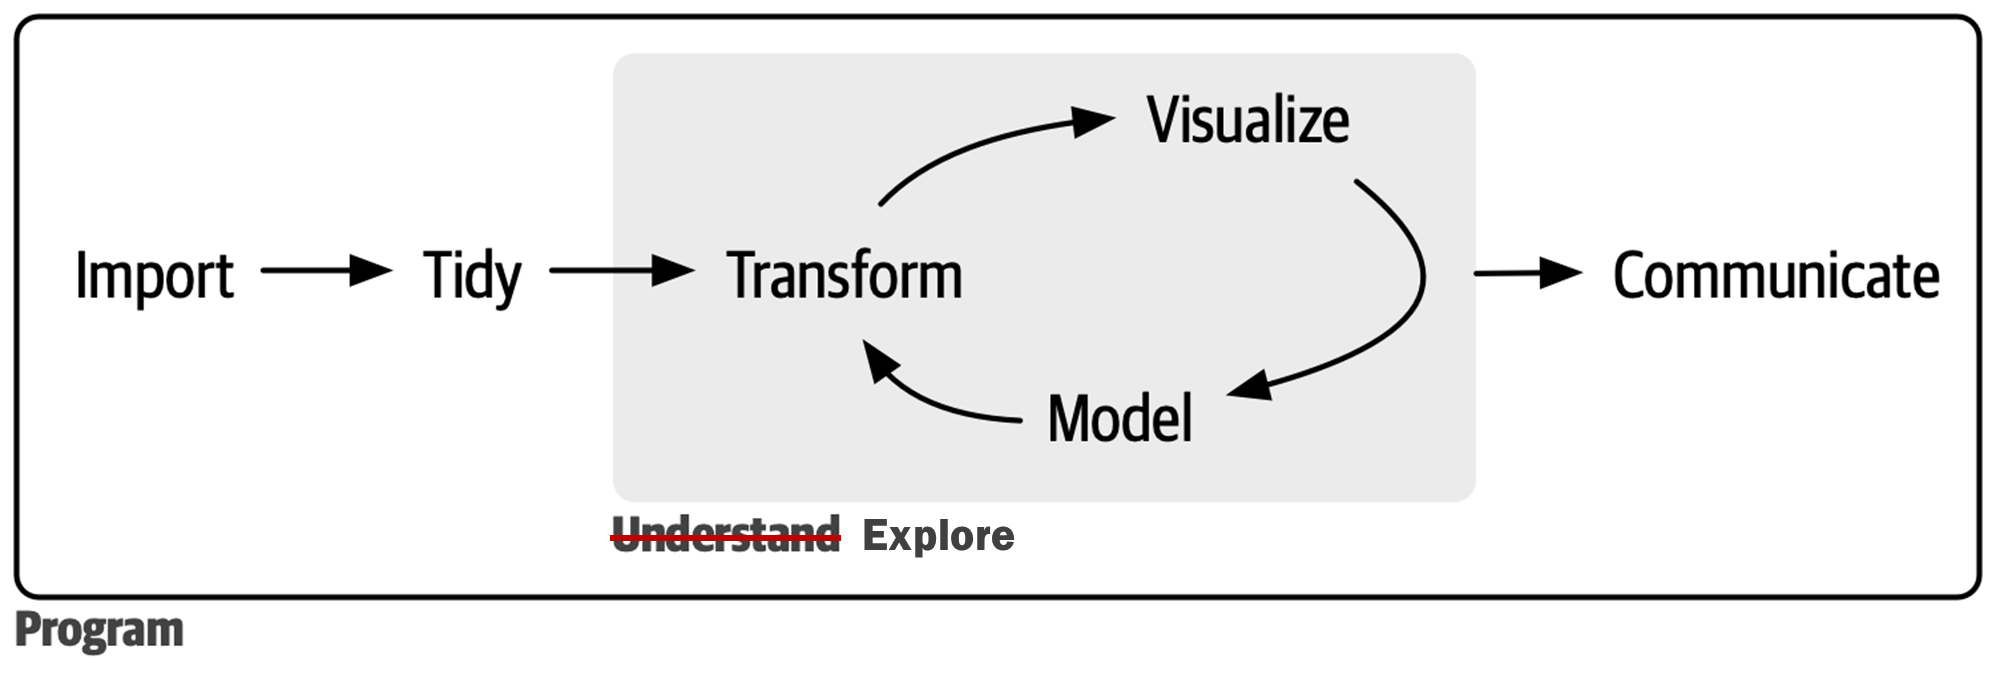
고차원적 탐색과 커뮤니케이션을 위한 시각화
내용
-
동적ㆍ반응형 시각화
- 역동성과 상호작용성이 부가된 시각화
- 방식
- 임베딩(embedding)
- 동적ㆍ반응형 테이블과 그래프 제작
-
지리공간적 시각화
- “지도는 텍스트, 테이블, 챠트 보다 훨씬 더 효과적으로 정보를 전달할 수 있다.”
- 공간사이언스(spatial science)의 지식 필요
- 정적, 동적ㆍ반응형
자바스크립트 라이브러리: 정의
JavaScript Library
-
자바스크립트 프로그래밍 언어를 사용하여 웹 개발을 더 쉽고 효율적으로 할 수 있도록 도와주는 재사용 가능한 코드 모음
동적ㆍ반응형 웹 페이지 제작을 위한 다양한 기능 제공
HTML의 script 태그를 통해 웹사이트에 임베딩 가능
R의 래퍼 패키지를 통해 손쉽게 사용 가능
자바스크립트 라이브러리: 종류
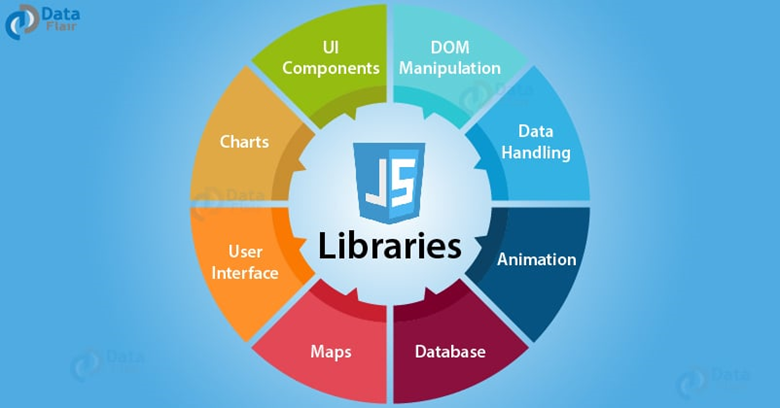
자바스크립트 라이브러리: 데이터 시각화
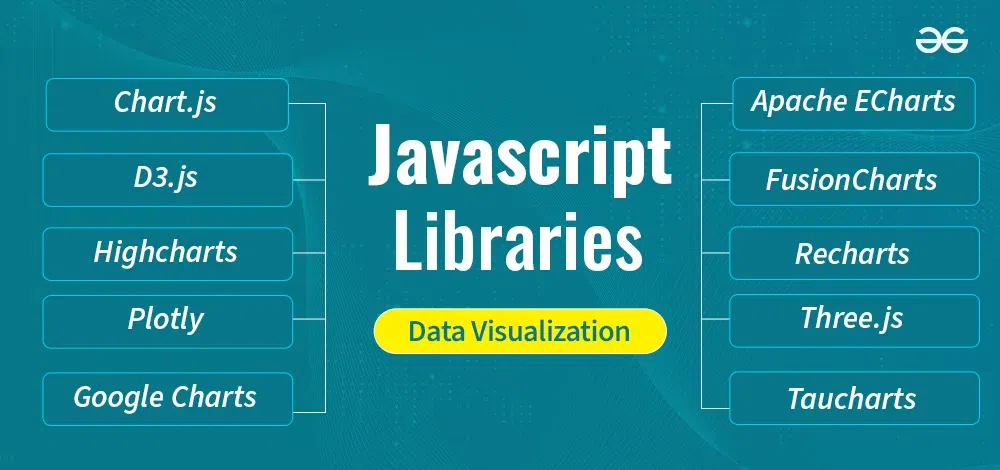
https://www.geeksforgeeks.org/javascript-libraries-for-data-visualization/
동적ㆍ반응형 시각화
임베딩 Embedding
동적ㆍ반응형 시각화가 구현되어 있는 웹사이트를 내재화
HTML의
iframe태그 활용
임베딩 Embedding: 사례 1
- 통계놀이터(https://kosis.kr/edu/)
임베딩 Embedding: 사례 2
- Our World in Data(https://ourworldindata.org/)
테이블 Tables
-
테이블 역시 시각화의 일부
데이터 변형 및 요약을 거친 테이블
시각성이 가미된 테이블
인트렉티브 테이블
테이블 Tables
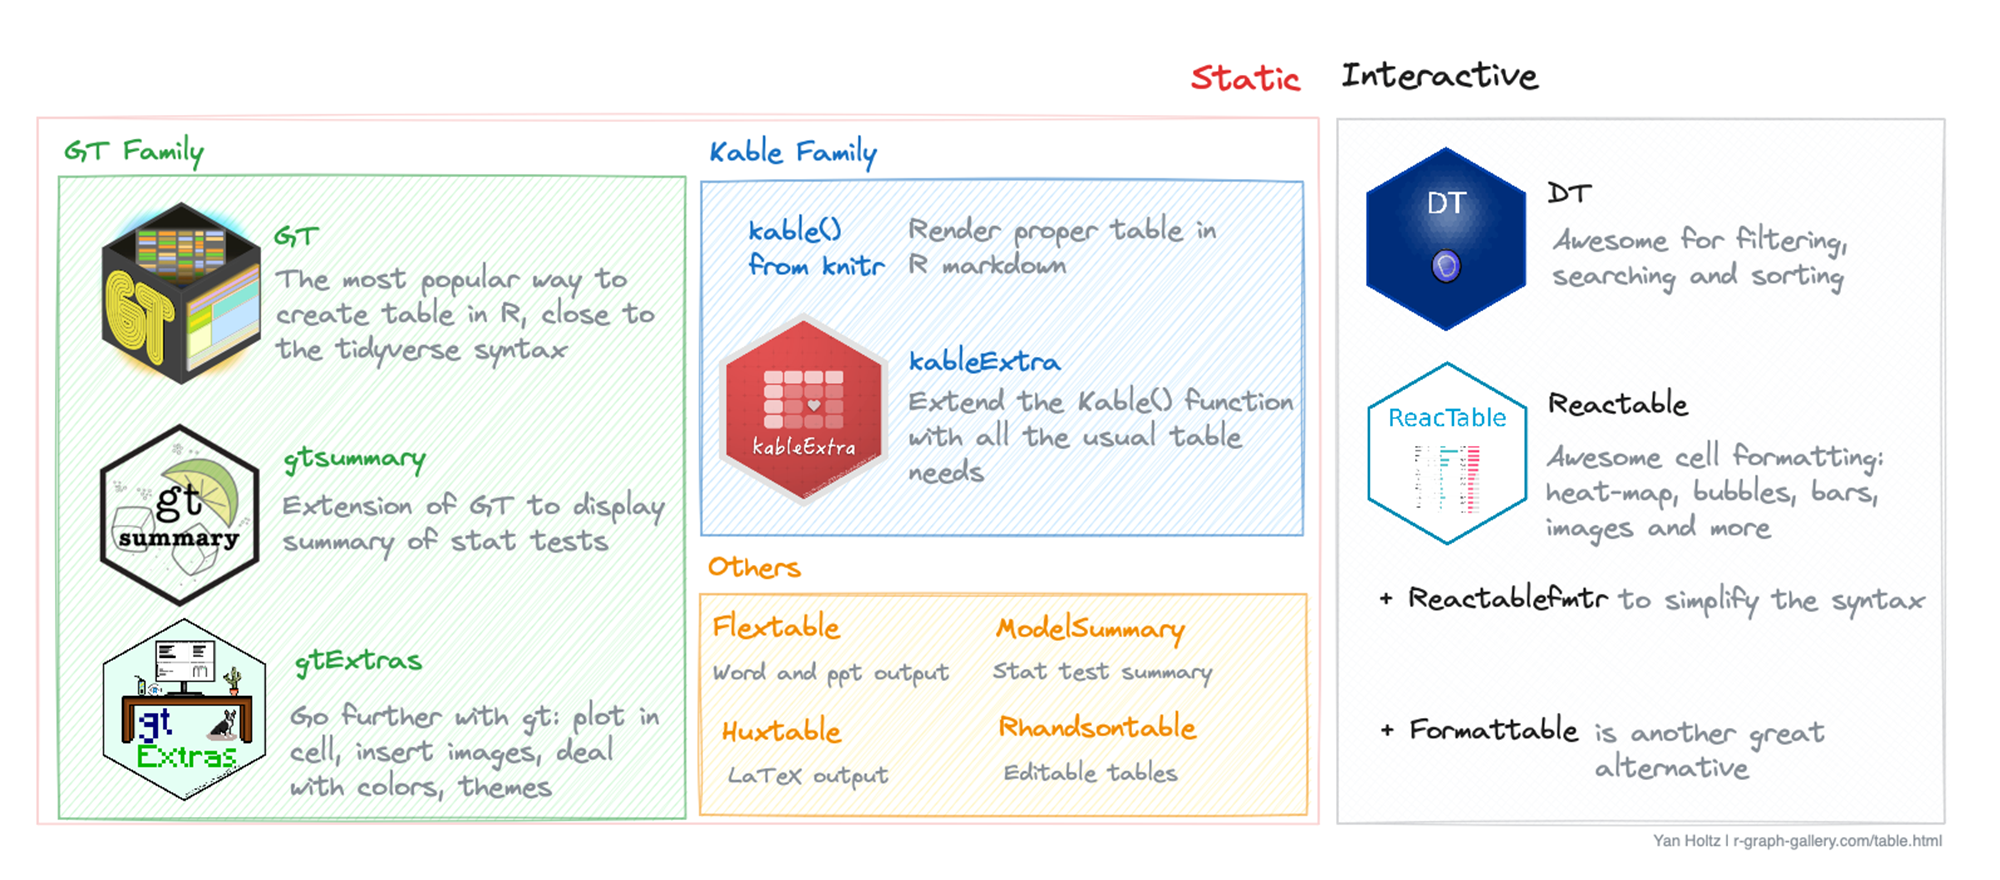
테이블 Tables: gt 패키지
테이블 Tables: gt 패키지
테이블 Tables: gt 패키지
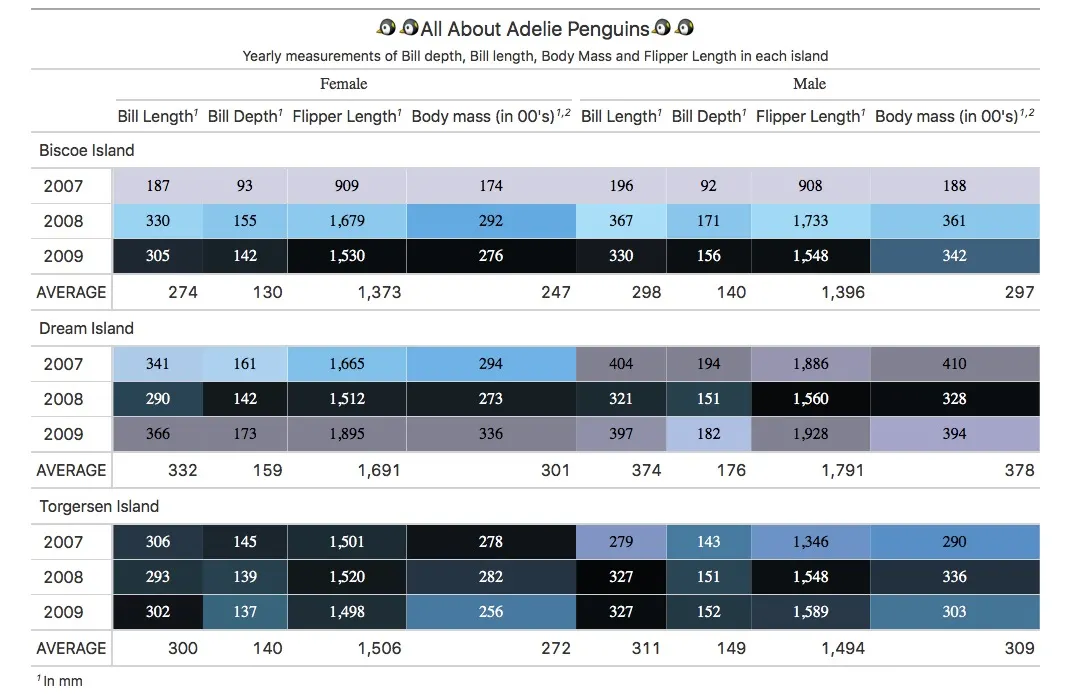
https://towardsdatascience.com/exploring-the-gt-grammar-of-tables-package-in-r-7fff9d0b40cd
테이블 Tables: DT 패키지
-
DataTables: 자바스크립트 라이브러리, 인트렉티브 테이블 객체 생성
-
DT: R 래퍼 패키지
-
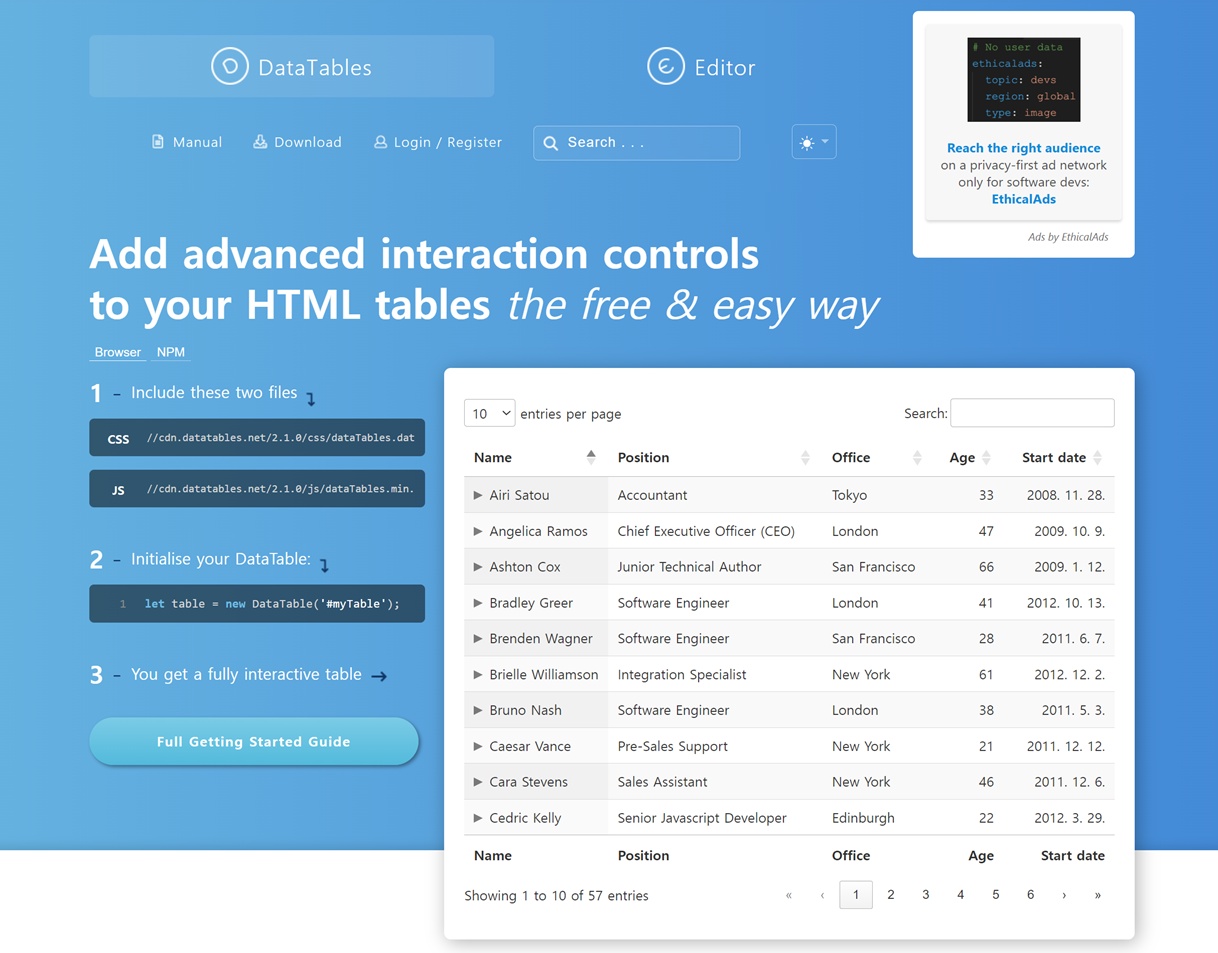
테이블 Tables: DT 패키지
Pagination: 페이지 이동 기능
Instant search: 즉각적 검색 기능(Search에 타이핑하기 시작하면 즉각적으로 검색 결과 보여줌)
Ordering/sorging: 컬럼 정렬 기능
Multi-column ordering: 다중 컬럼 정렬 기능(컬럼 하나를 선택한 후 ctrl을 누른 상태에서 다른 컬럼을 선택)
Filtering: 값 추림 기능
Editable: 셀 값 수정 기능
Buttons: 셀 숨기기 기능, CSV, PDF, XLSX 등의 확장자로 내보내기 등을 수행하는 버튼 생성 기능
테이블 Tables
그래프 Graphs
| 자바스크립트 라이브러리 | R 래퍼 패키지 |
|---|---|
| Plotly | plotly |
| D3 | r2d3 |
| Highcharts | highcharter |
| ECharts | echarts4r |
| dygraphs | dygraphs |
| Google Charts | googleVis |
| Chart.js | chartjs |
그래프 Graphs: plotly 패키지

그래프 Graphs: plotly 패키지
그래프 Graphs: plotly 패키지
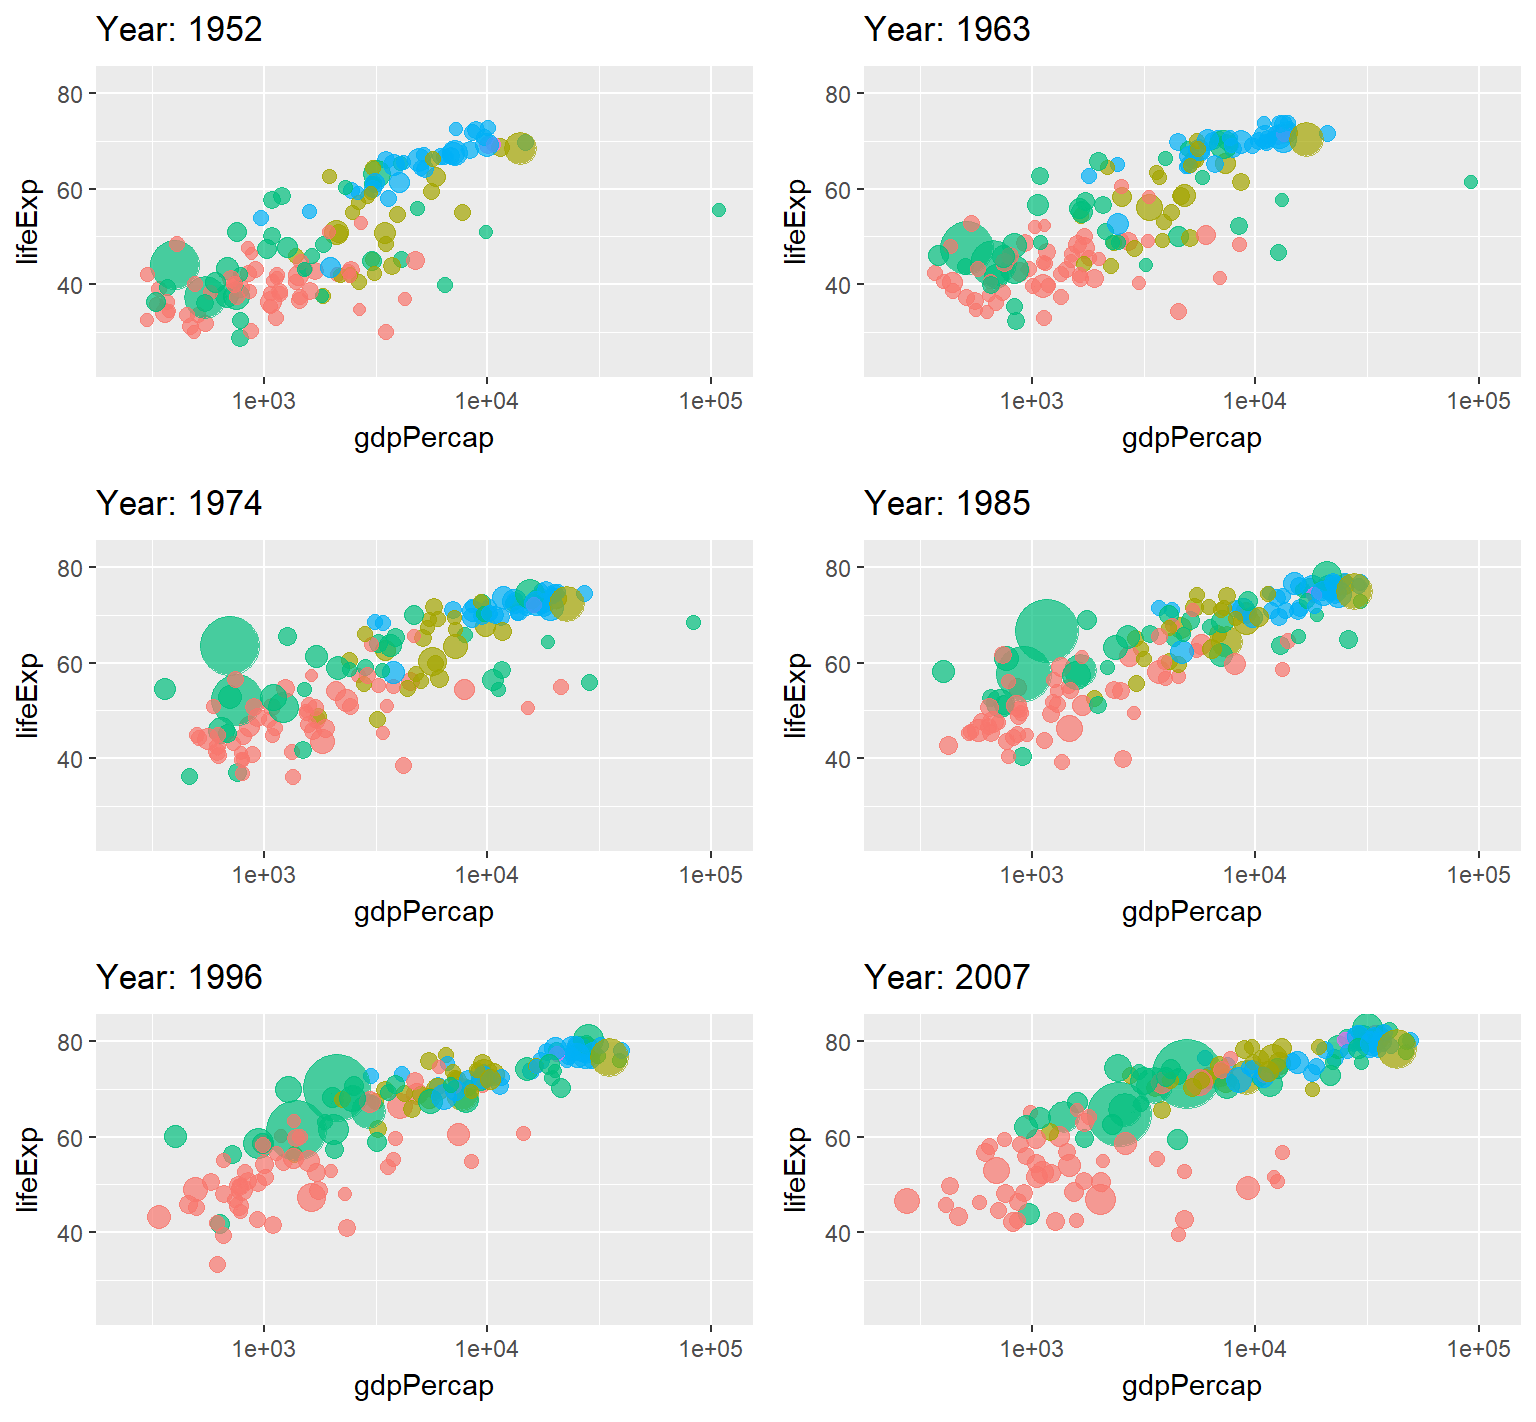
그래프 Graphs: ggplotly() 함수
그래프 Graphs: gganimate 패키지
지리공간적 시각화
지리공간적 데이터의 종류
-
벡터(vector) 데이터
포인트, 라인, 폴리곤
형상 데이터 + 속성 데이터
-
래스터(raster) 데이터
그리드 셀(grid cell)
일체형
지리공간적 데이터의 종류
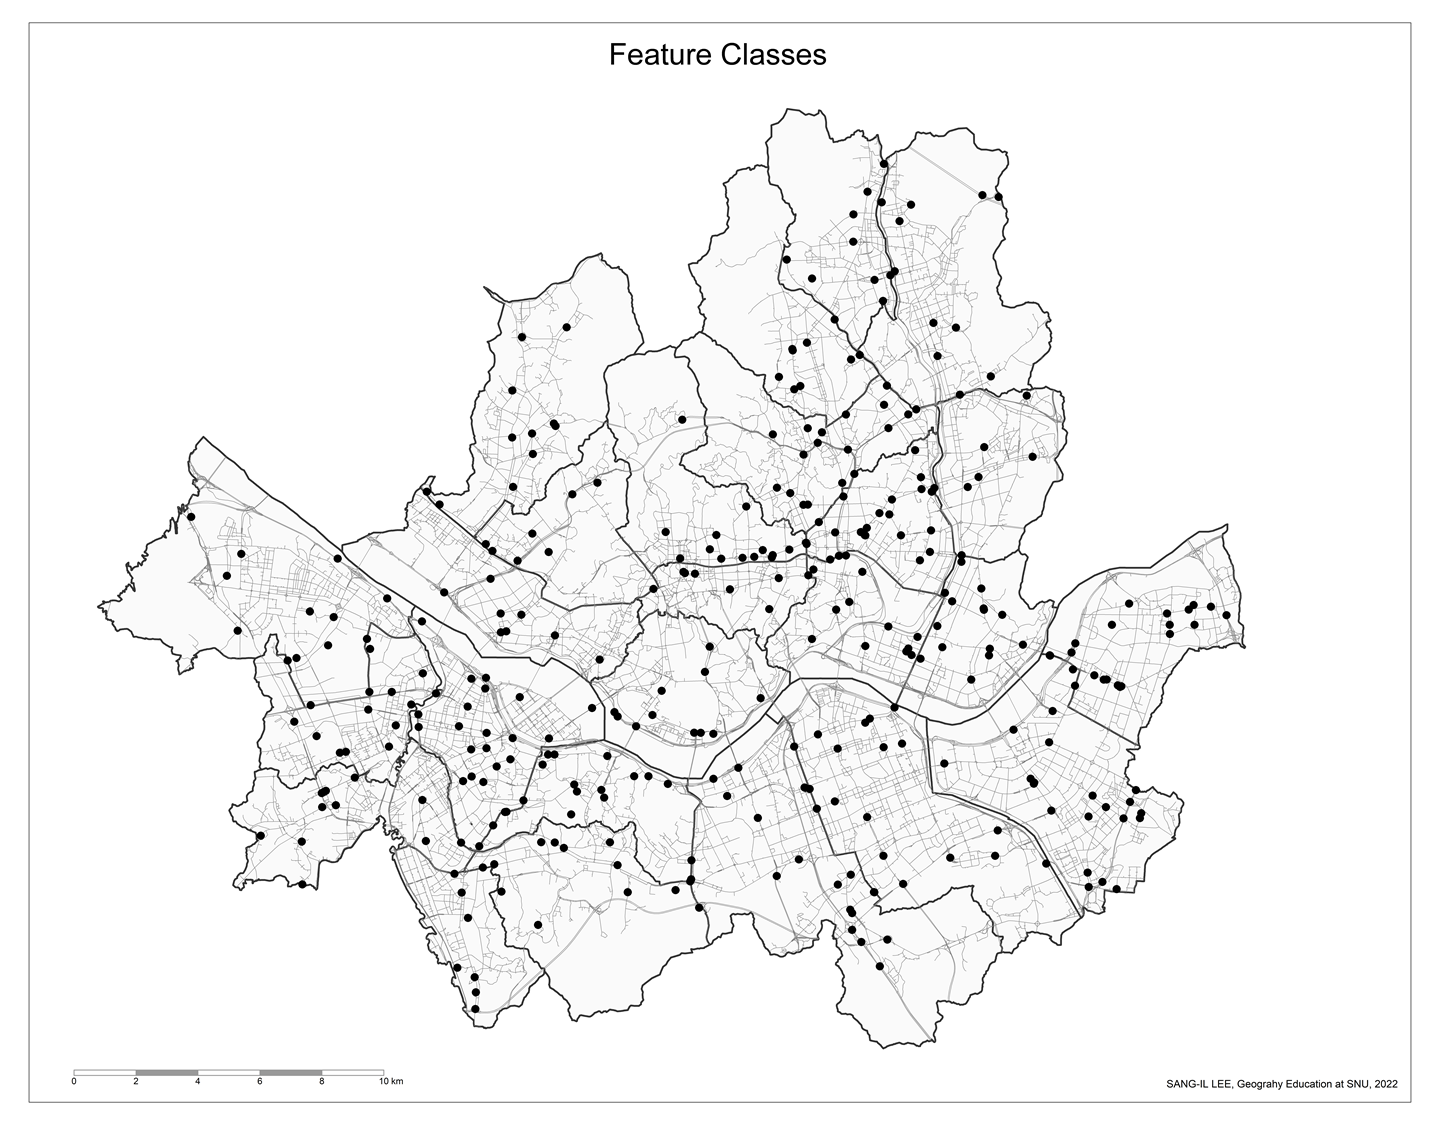
지리공간적 데이터의 종류
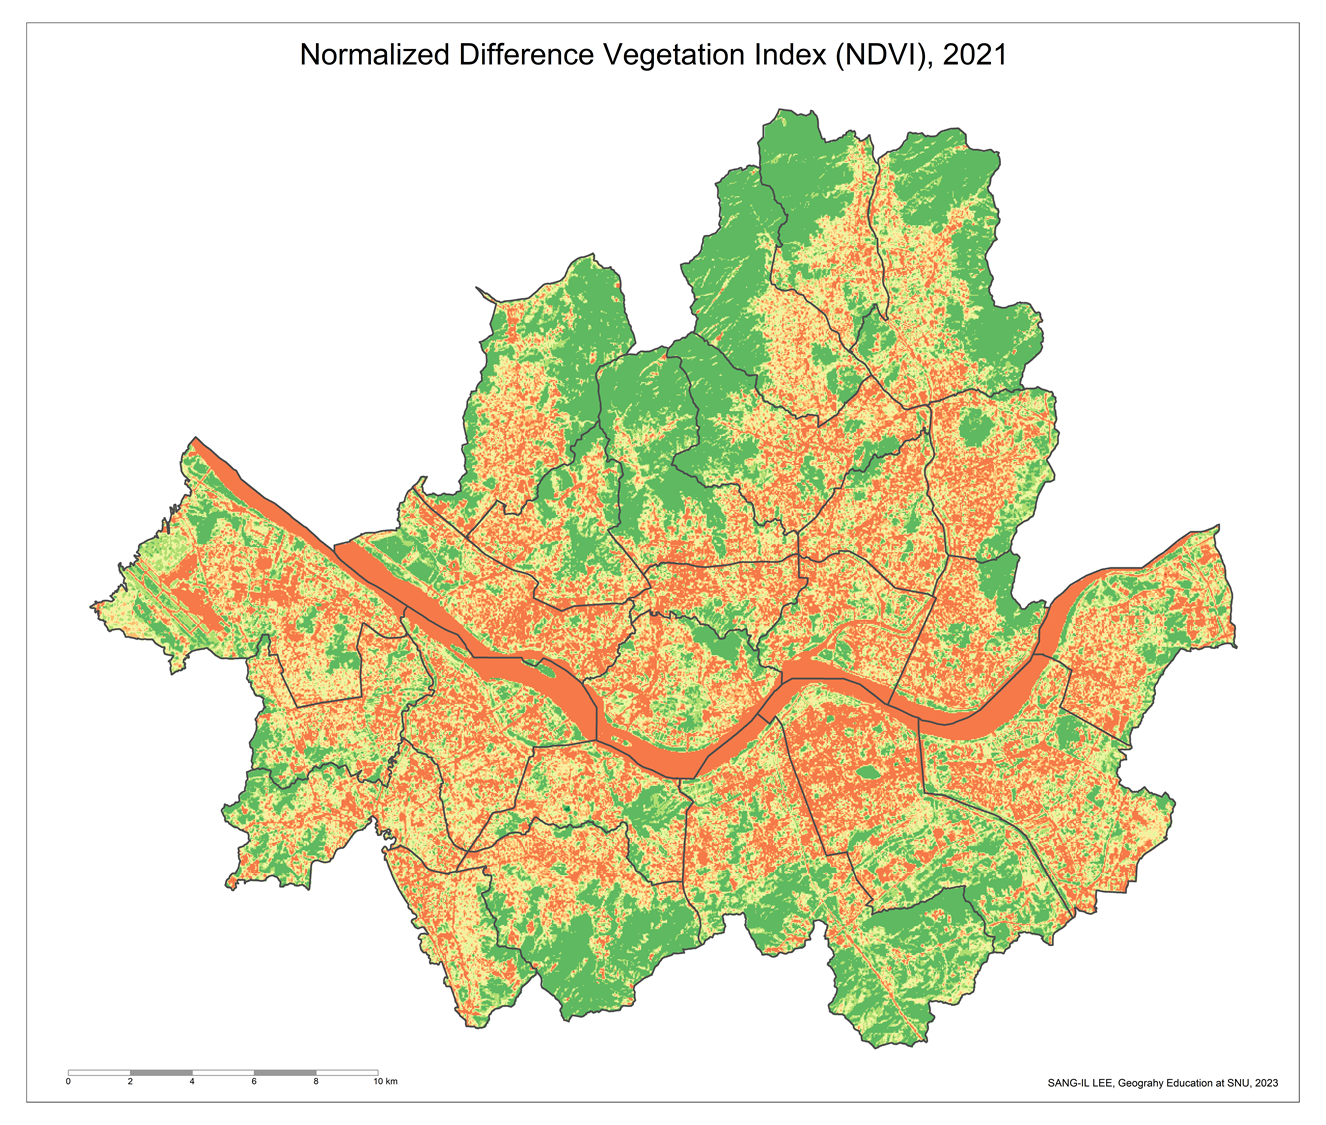
벡터 데이터
-
벡터 데이터: 형상 데이터 + 속성 데이터
-
형상 데이터 (기하, 도형, 공간 데이터)
행정구역과 같은 지리공간적 객체 자체에 대한 데이터
포인트(점), 라인(선), 폴리곤(역)로 구분
버텍스(vertex)의 좌표값
-
속성 데이터
지리공간적 객체가 보유한 속성
기존 일반 데이터와 동일
-
-
조인:
left_join()함수왼편: 형상 데이터
오른편: 속성 데이터
벡터 데이터
-
셰이프 파일(shape file): 가장 널리 사용되는 형상 데이터
sigungu.shp: 버텍스의 좌표값이 포함된 핵심 파일sigungu.shx: 공간적 인덱싱 파일sigungu.dbf: 기본 속성 파일sigungu.prj: 투영 정보 파일
-
특수한 패키지 필요:
sf패키지-
st_read()함수
-
sf 패키지
sf 패키지: 주요 함수
읽고 쓰기:
st_read(),st_write()투영 관련:
st_crs(),st_transform()기하 측정:
st_area(),st_length(),st_perimeter(),st_distance()기하 변형:
st_centroid(),st_buffer(),st_boundary(),st_simplify()기하 생성:
st_point(),st_voronoi(),st_convex_hull(),st_make_grid()기하 검토:
st_is_valid(),st_make_valid()기하 중첩:
st_intersection(),st_union(),st_crop()기타:
st_coordinates(),st_cast(),st_as_sf(),st_graticule(),st_join()
sf 패키지: st_read()
CRS
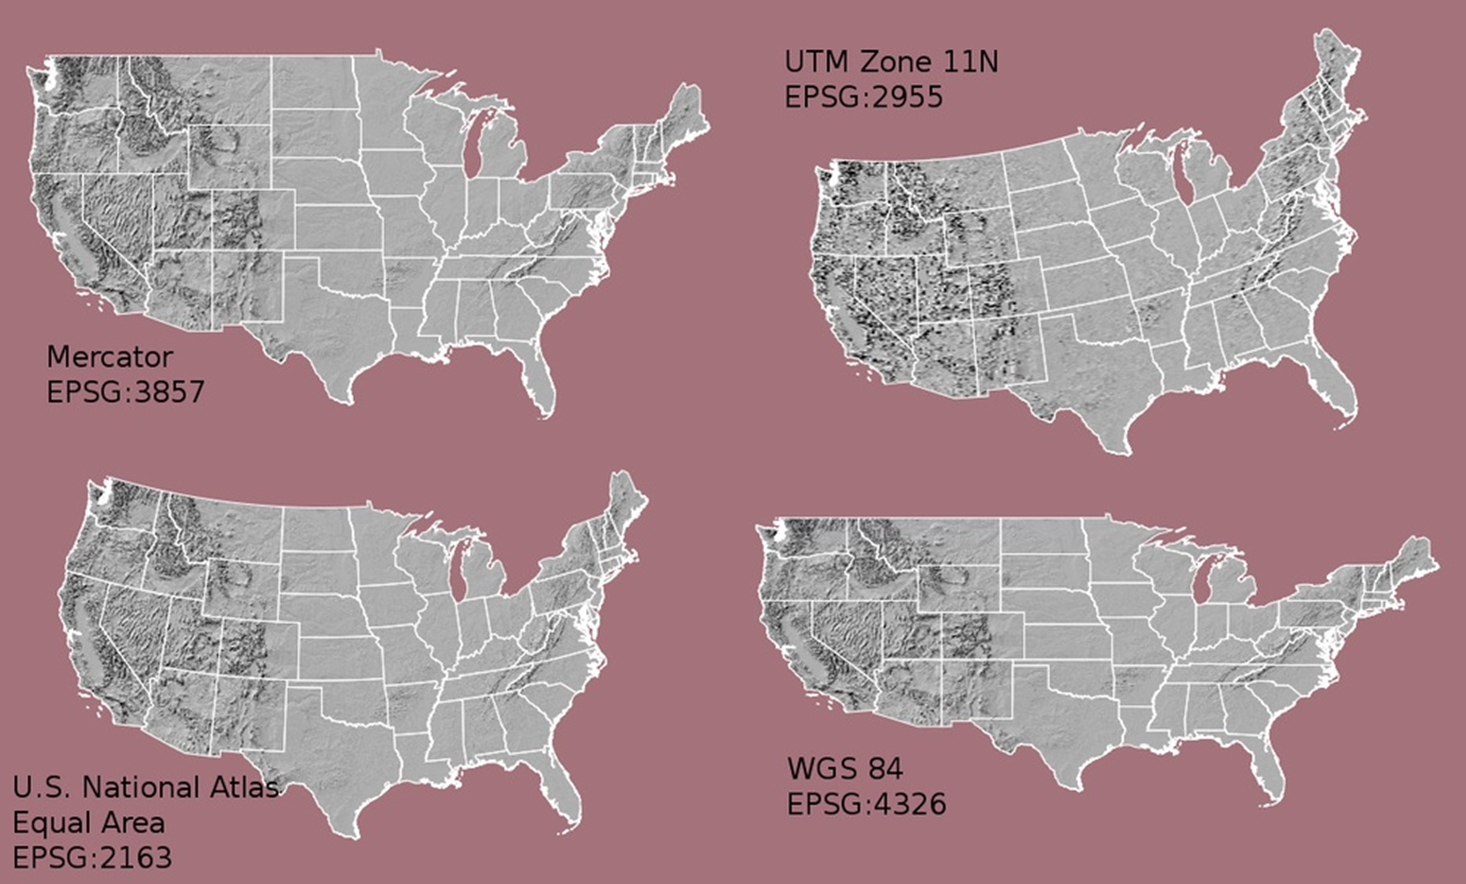
https://datacarpentry.org/organization-geospatial/03-crs.html
CRS: 정의
좌표참조계 Coordinate Reference System
-
모든 지리공간데이터는 특정한 좌표참조계에 의거해 제작되며 이러한 좌표참조계는 매우 다양함
준거타원체
투영법(map projection)
투영 파라미터: 투영축, 투영격, 중앙경선, 가상원점 등
지리공간데이터의 SRID(Spatial Reference System Identifiers, 공간참조계식별자)
sf패키지:st_crs()함수
CRS: 방식
-
PROJ 정형문자열
- https://proj.org/en/9.4/
- 준거타원체, 투영법, 투영 파라미터를 + 기호로 연결해 작성한 문자열
- UTM-K
- +proj=tmerc +lat_0=38 +lon_0=127.5 +k=0.9996 +x_0=1000000 +y_0=2000000 +ellps=GRS80 +units=m
-
EPSG 숫자코드
- https://epsg.io/
- 모든 CRS에 1024~32767 사이의 고유 숫자를 부여
- UTM-K
- EPSG: 5179
CRS: PROJ 정형문자열
- 세계지도를 위한 주요 투영법의 PROJ 별명(alias)
| 투영법 | PROJ 파라미터 |
|---|---|
| 정적원통 도법 Equal Area Cylindrical | +proj=cea |
| 컴펙트 밀러 도법 Compact Miller | +proj=comill |
| 에케르트 IV 도법 Eckert IV | +proj=eck4 |
| 정거원통 도법 Equidistant Cylindrical | +proj=eqc |
| 구드 도법 Goode Homolosine | +proj=goode |
| 단열형 구드 도법 Interrupted Goode Homolosine | +proj=igh |
| 메르카토르 도법 Mercator | +proj=merc |
| 몰바이데 도법 Mollweide | +proj=moll |
| 로빈슨 도법 Robinson | +proj=robin |
| 시뉴소이드 도법 Sinusoidal | +proj=sinu |
| 빈켈트리펠 도법 Winkel Tripel | +proj=wintri |
CRS: EPSG 숫자코드
- 널리 사용되는 CRS의 EPSG
| 적용 스케일 | EPSG 숫자코드 | 설명 |
|---|---|---|
| 전세계 | EPSG:4326 | WGS84, 측지좌표계, GPS에 사용 |
| EPSG:3857 | 웹 메르카토르 도법, 구글 맵스, 오픈스트리트맵에서 사용 | |
| EPSG:7789 | ITRF2014 | |
| 미국 | EPSG:2163 | 알베르스 정적원추 도법 |
| 유럽 | EPSG:3035 | 람베르트 정적방위 도법 |
| 우리나라 | EPSG:5179 | UTM-K |
| EPSG:5185 | 서부원점 | |
| EPSG:5186 | 중부원점 | |
| EPSG:5187 | 동부원점 | |
| EPSG:5188 | 동해원점 |
CRS: 세계지도에 적용
지리공간적 시각화: 코로플레스맵
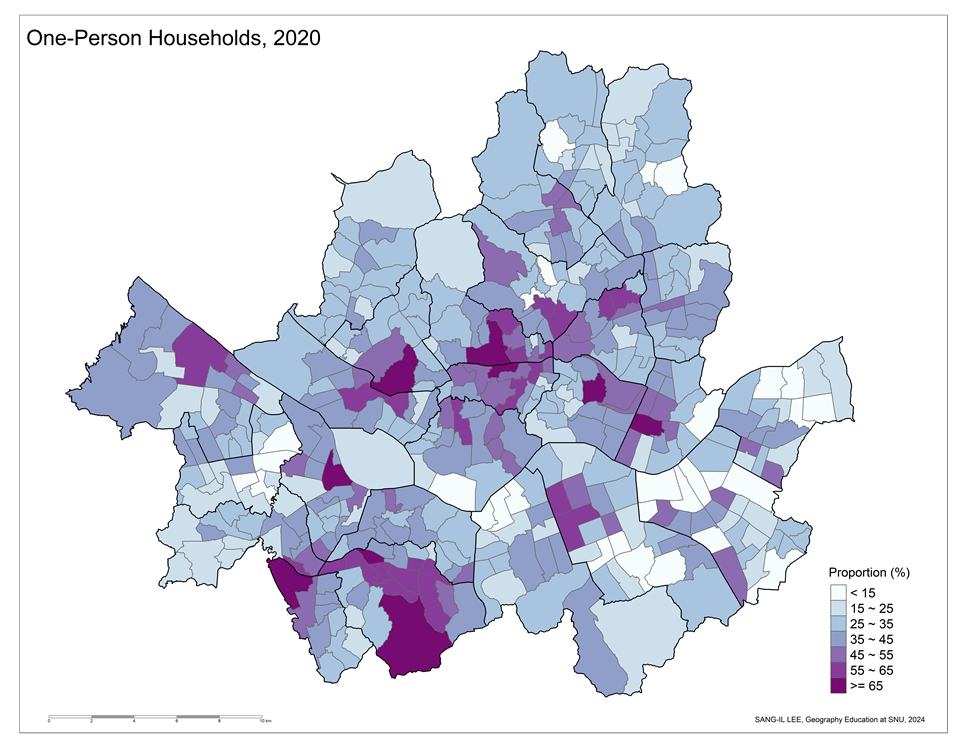
지리공간적 시각화: 두 가지 관점
ggplot2 vs tmap: 세계지도
world_map <- ggplot() +
  geom_sf(data = world_data, aes(fill = TFR, text = name_long)) +
  coord_sf(crs = "+proj=robin") +
  scale_fill_viridis_c() +
  scale_x_continuous(breaks = seq(-180, 180, 30)) +
  scale_y_continuous(breaks = c(-89.5, seq(-60, 60, 30), 89.5)) +
  theme(
    panel.background = element_rect("white"),
    panel.grid = element_line(color = "gray80")
  )
world_map

ggplot2 vs tmap: 우리나라 지도
library(ggspatial)
sigungu_data <- sigungu_data |>
  mutate(
    index_class = case_when(
      index < 0.2 ~ "1",
      index >= 0.2 & index < 0.5 ~ "2",
      index >= 0.5 & index < 1.0 ~ "3",
      index >= 1.0 & index < 1.5 ~ "4",
      index >= 1.5 ~ "5"
    ),
    index_class = fct(index_class, levels = as.character(1:5))
  )
class_color <- c("1" = "#d7191c", "2" = "#fdae61",
                 "3" = "#ffffbf", "4" = "#a6d96a",
                 "5" = "#1a9641")
ggplot_map <- ggplot() +
  geom_sf(
    data = sigungu_data,
    aes(fill = index_class, text = SGG1_FNM),
    show.legend = TRUE
  ) +
  geom_sf(
    data = sido_shp,
    fill = NA,
    lwd = 0.5
  ) +
  scale_fill_manual(
    name = "Classes",
    labels = c("< 0.2", "0.2 ~ 0.5", "0.5 ~ 1.0",
               "1.0 ~ 1.5", ">= 1.5"),
    values = class_color, drop = FALSE
  ) +
  annotation_scale(
    location = "br",
    bar_cols = c("gray40", "white"),
    width_hint = 0.4
  )
ggplot_map
class_color <- c("#d7191c", "#fdae61", "#ffffbf", "#a6d96a", "#1a9641")
tmap_map <- tm_shape(sigungu_data) +
  tm_polygons(
    col = "index", style = "fixed", palette = class_color,
    breaks = c(0, 0.2, 0.5, 1.0, 1.5, Inf),
    labels = c("< 0.2", "0.2 ~ 0.5", "0.5 ~ 1.0",
               "1.0 ~ 1.5", ">= 1.5"),
    title = "Classes", id = "SGG1_FNM"
  ) +
  tm_shape(sido_shp) + tm_borders(lwd = 1.5) +
  tm_legend(
    legend.position = c(0.7, 0.1)
  ) +
  tm_scale_bar(breaks = seq(0, 200, 50), position = c(0.6, 0.01))
tmap_map
인터랙티브 지도: ggplotly() 함수
인터렉티브 지도: ggiraph 패키지
library(ggiraph)
sigungu_data <- sigungu_data |>
  mutate(
    index = format(index, digits = 4, nsmall = 4),
    my_tooltip = str_c("Name: ", SGG1_FNM, "\n Index: ", index)
  )
gg <- ggplot() +
  geom_sf_interactive(
    data = sigungu_data,
    aes(
      fill = index_class,
      tooltip = my_tooltip,
      data_id = SGG1_FNM
    ),
    show.legend = TRUE
  ) +
  geom_sf(
    data = sido_shp,
    fill = NA,
    lwd = 0.5
  ) +
  scale_fill_manual(
    name = "Classes",
    labels = c("< 0.2", "0.2 ~ 0.5", "0.5 ~ 1.0",
               "1.0 ~ 1.5", ">= 1.5"),
    values = class_color, drop = FALSE
  )
girafe(ggobj = gg) |>
  girafe_options(
    opts_hover(css = "fill: gray")
  )
leaflet: 자바스크립트 라이브러리
- R 래퍼 패키지:
leaflet
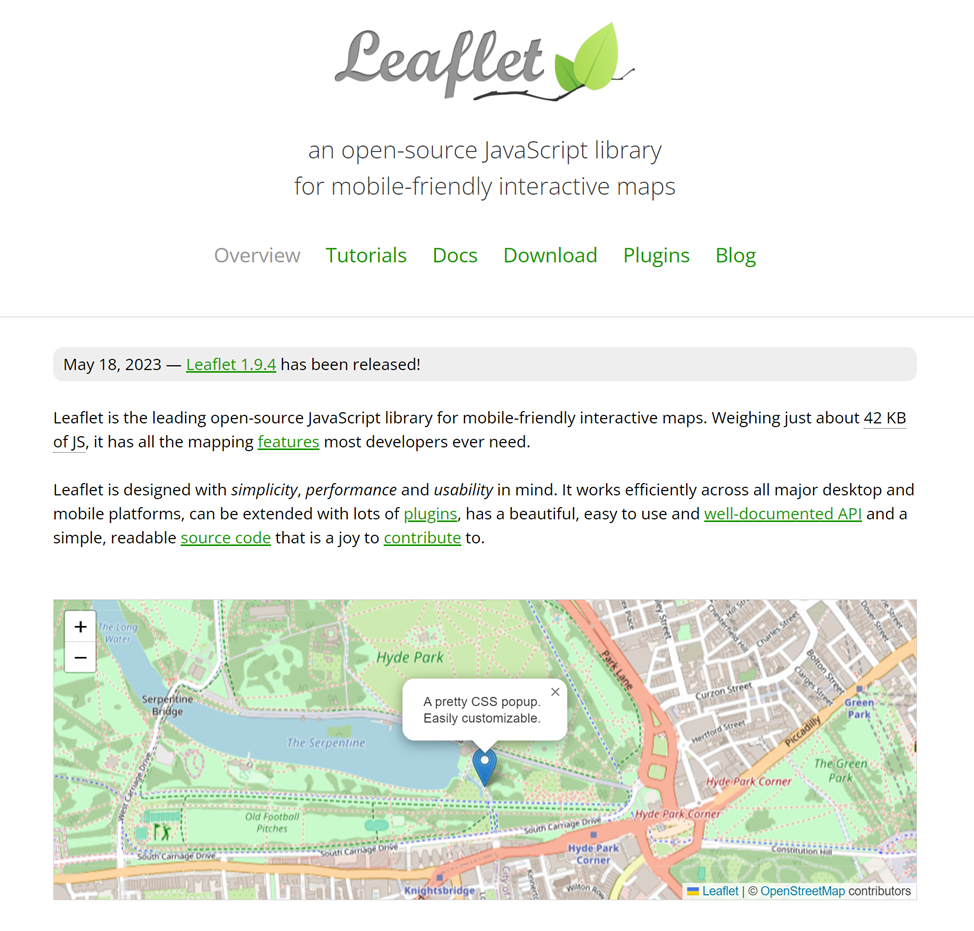
leaflet: 단순 일반도
leaflet: 매시업(mashup) 주제도
library(leaflet)
world_data <- world_data |>
  filter(
    !is.na(TFR)
  )

bins <- c(0, 1.5, 2.1, 3, 4, 5, Inf)
pal <- colorBin("YlOrRd", domain = world_data$TFR, bins = bins)
labels <- sprintf("<strong>%s</strong><br/>%g",
  world_data$name_long, world_data$TFR) |> lapply(htmltools::HTML)

leaflet(world_data) |>
  addProviderTiles(providers$Esri.WorldTopoMap) |>
  addPolygons(
    fillColor = ~pal(TFR),
    weight =  2,
    opacity = 1,
    color = "white",
    dashArray = "3",
    fillOpacity = 0.6,
    highlightOptions = highlightOptions(
      weight = 5,
      color = "#666",
      dashArray = "",
      fillOpacity = 0.6,
      bringToFront = TRUE),
    label = labels,
    labelOptions = labelOptions(
      style = list("font-weight" = "normal", padding = "3px 8px"),
      textsize = "15px",
      direction = "auto")
  ) |>
  addLegend(
    pal = pal, values = ~TFR, opacity = 0.6, title = NULL,
    position = "bottomright"
)library(tmap)
class_color <- c("#d7191c", "#fdae61", "#ffffbf", "#a6d96a", "#1a9641")
sigungu_data <- sigungu_data |>
mutate(
index = as.numeric(index)
)
tmap_mode(mode = "view")
my_tmap <- tm_shape(sigungu_data) +
tm_polygons(
col = "index",
palette = class_color,
breaks = c(0, 0.2, 0.5, 1.0, 1.5, Inf),
labels = c("< 0.2", "0.2~0.5", "0.5~1.0", "1.0~1.5", ">= 1.5"),
title = "Classes",
popup.vars=c("지역소멸위험지수: " = "index"),
popup.format = list(index = list(digits = 3)),
id = "SGG1_FNM",
alpha = 0.6,
border.alpha = 0.5
) +
tm_shape(sido_shp) + tm_borders(lwd = 2)
my_tmap
사회과 예비교사를 위한 AIㆍ디지털 역량강화 워크숍
