Day 3
탐색적 데이터 분석

이상일(서울대학교 지리교육과 교수)

2024-08-07

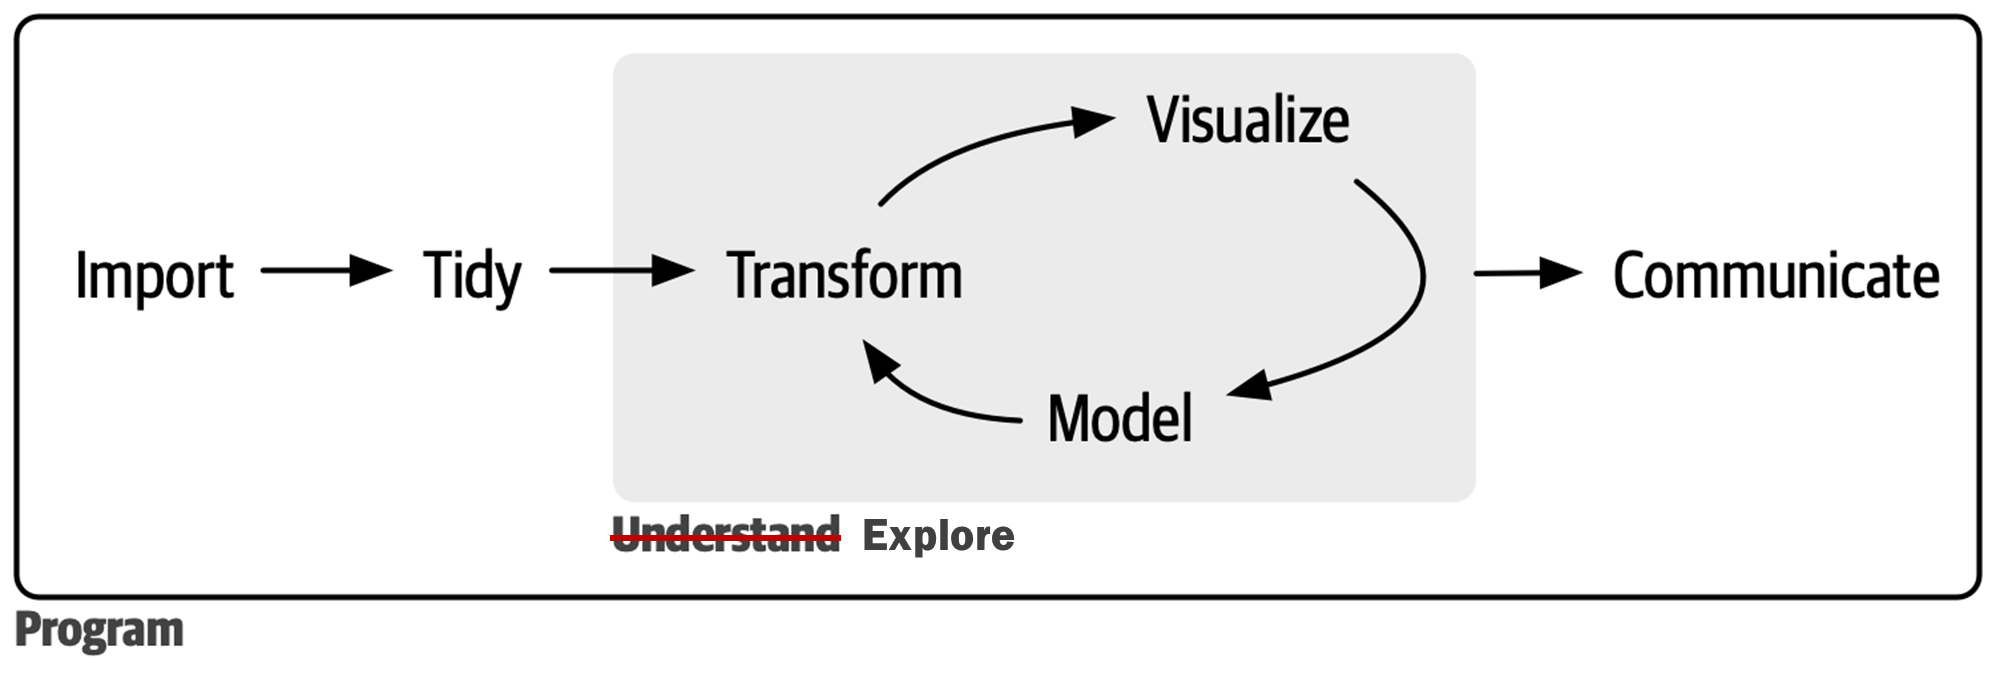
데이터사이언스 프로세스의 심장

https://r4ds.hadley.nz/intro

탐색적 데이터 분석: 개념

  • 탐색적 데이터 분석은 데이터와의 끝임없는 상호작용을 통해 의미있는 결과물을 얻어내는 과정을 의미한다. 데이터사이언스가 데이터로부터 이해, 지식, 통찰력을 획득하는 과정이라고 했을 때, 탐색적 데이터 분석은 데이터사이언스의 심장이라 해도 과언이 아니다. 상호작용은 데이터와의 질의응답의 연쇄과정을 의미한다. 의미있는 질문에 답을 얻기 위해서는 거의 반드시 데이터를 변형하거나 시각화해야만 한다.

  • 데이터 변형과 데이터 시각화는 개별적으로 탐색적 데이터 분석에 기여한다. 데이터 변형은 데이터를 다른 각도로 바라볼 수 있게 해주고 다양한 요약 통계값을 산출해 준다. 데이터 시각화는 데이터에 차원을 부가함으로써 시각화 되지 않았다면 발견할 수 없었던 것을 발견할 수 있게 해준다.

탐색적 데이터 분석: 개념

  • 데이터 변형에서 데이터 시각화로 이어지는 시퀀스가 탐색적 데이터 분석의 핵심적인 방법론이다. 데이터 변형의 궁극적인 목적은 바로 데이터 시각화를 위한 준비이다. 특정한 형태의 시각화를 위해서는 특정한 형태로 변형된 데이터가 필수적이고, 그러한 과정이 이해, 지식, 통찰력의 획득으로 나아가게 해주는 주된 경로이다.

  • 데이터 시각화의 두 가지 목적은 탐색커뮤니케이션이다. 우리가 데이터 시각화를 하는 첫번째 목적은 데이터에 대한 질문에 답을 찾기 위해서이다. 우리가 데이터를 시각화하는 두 번째 목적은 우리가 발견한 것을 다른 사람들과 ‘잘’ 커뮤니케이션하기 위해서이다.

탐색적 데이터 분석: 절차

  • 의미있는 질문을 생성한다.

  • 질문에 답할 수 있는 그래픽(플롯, 지도 등)을 구상한다.

  • 구상한 그래픽에 부합하도록 데이터를 변형한다.

  • 변형한 데이터를 구상한 그래픽으로 시각화한다.

  • 그래픽으로부터 질문의 답을 구하고, 더 나아가 지식, 이해, 통찰을 이끌어 낸다.

탐색적 데이터 분석: 예시

대륙별 최대국(인구가 가장 많은 나라)이 소속 대륙 전체에서 차지하는 비중이 어느 정도이고 대륙별로 어느 정도의 차이가 있는지, 그리고 대륙별 최대국의 비중이 시간이 지남에 따라 어떠한 변화 양상을 보여주고 있고, 그러한 양상에 대륙별 차이가 있는지의 여부

# A tibble: 1,704 × 6
   country     continent  year lifeExp      pop gdpPercap
   <fct>       <fct>     <int>   <dbl>    <int>     <dbl>
 1 Afghanistan Asia       1952    28.8  8425333      779.
 2 Afghanistan Asia       1957    30.3  9240934      821.
 3 Afghanistan Asia       1962    32.0 10267083      853.
 4 Afghanistan Asia       1967    34.0 11537966      836.
 5 Afghanistan Asia       1972    36.1 13079460      740.
 6 Afghanistan Asia       1977    38.4 14880372      786.
 7 Afghanistan Asia       1982    39.9 12881816      978.
 8 Afghanistan Asia       1987    40.8 13867957      852.
 9 Afghanistan Asia       1992    41.7 16317921      649.
10 Afghanistan Asia       1997    41.8 22227415      635.
# ℹ 1,694 more rows

gapminder |> 
  group_by(year, continent) |> 
  mutate(
    sum_cont = sum(pop),
    country_prop = pop * 100 / sum_cont
  ) |> 
  slice_max(country_prop) |> 
  ggplot() +
  geom_line(aes(x = year, y = country_prop, color = continent), linewidth = 1) +
  labs(x = "Year", y = "% of Population", color = "Continents") 

데이터 변형하기

dplyr 패키지

https://dplyr.tidyverse.org/

dplyr 기초

  • 함수의 이름은 기본적으로 동사이다.

  • 첫 번째 아규먼트는 항상 데이터 프레임이다.

  • 그 다음 아규먼트(들)는 데이터 변형에 결부되는 변수(들)를 지정한다 .

  • 산출물은 항상 데이터 프레임이다.

dplyr 함수의 유형

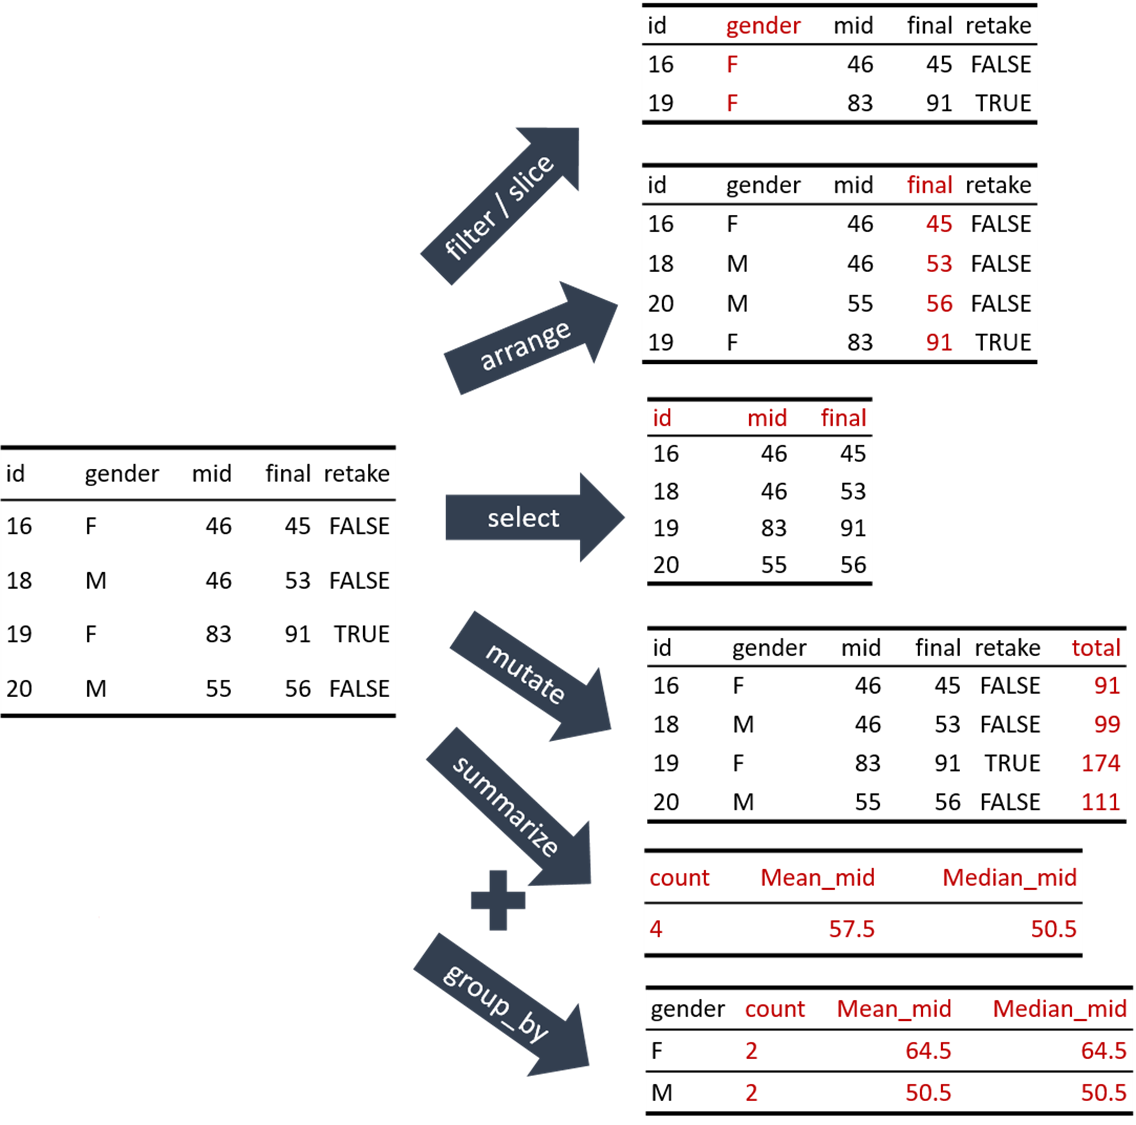
  • 행(rows) 함수: 행에 적용되는 함수, 즉 행의 변화를 야기하는 함수

  • 열(columns) 함수: 열에 적용되는 함수, 즉 열의 변화를 야기하는 함수

  • 그룹(groups) 함수: 그룹에 적용되는 함수

  • 테이블(tables) 함수: 데이터프레임 전체에 적용되는 함수

https://kilhwan.github.io/rprogramming/ch-dataTransformation.html

행 함수: 네 개의 주요 함수

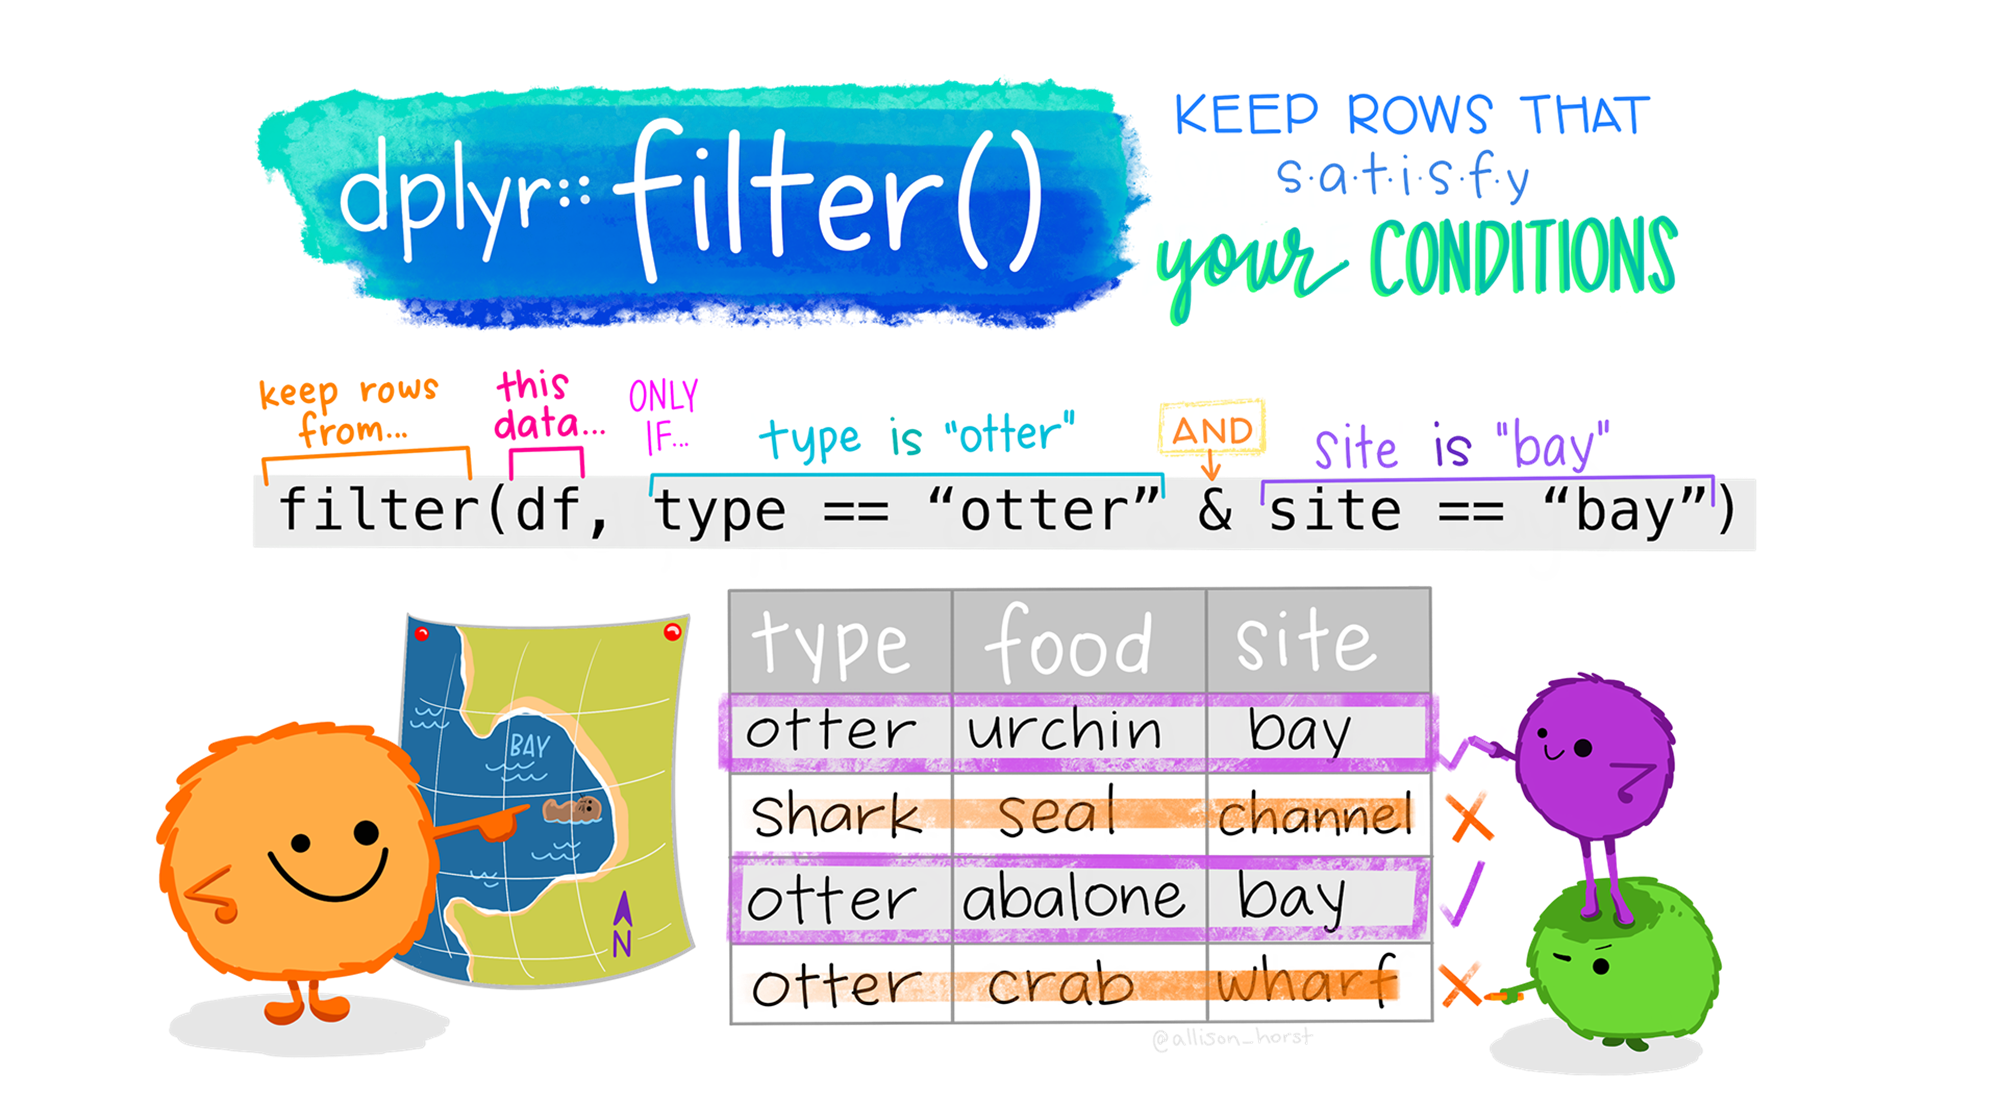
  • filter(): 특정 변수(들)에 의거한 조건을 만족하는 행(들)을 추출

  • arrange(): 특정 변수(들)에 의거해 행(들)의 순서를 변경

  • distinct(): 특정 변수(들)에 의거해 (중복을 제거한) 고유한 행(들)을 추출

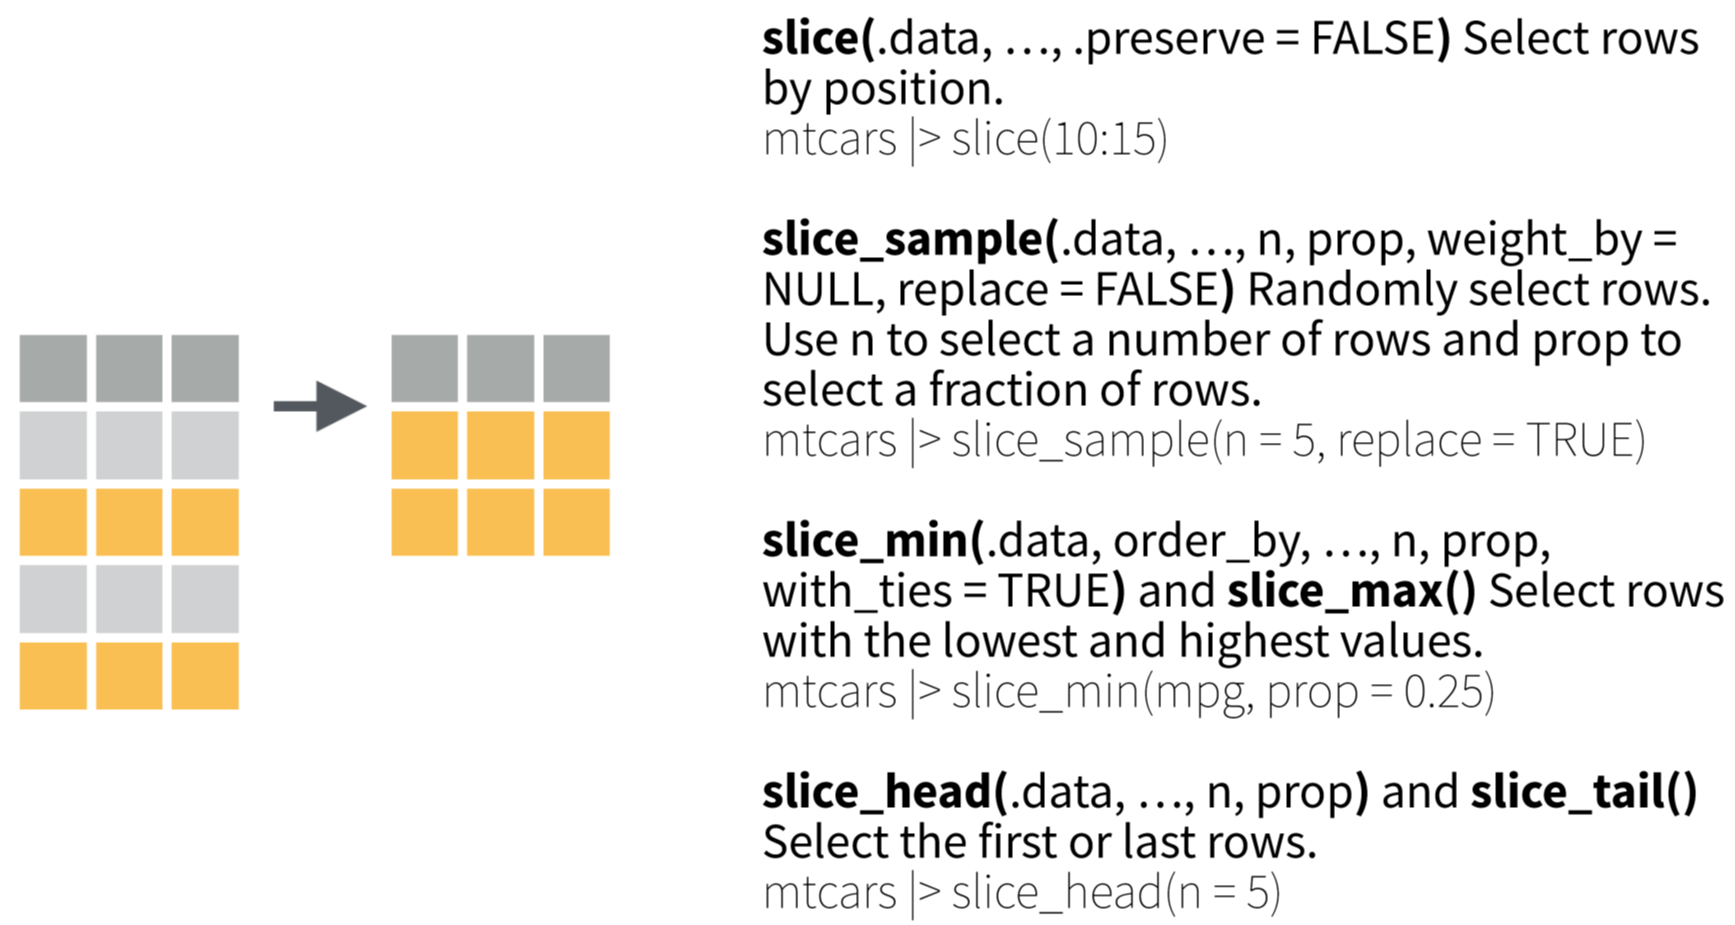
  • slice(): filter() 함수처럼 특정 행(들)을 추출

    • 특정 변수와 관계 없이, 행의 위치에 의거해 특정 행(들)을 추출

    • 특정 변수에 따른, 행의 위치에 의거해 행(들)을 추출

행 함수 1: filter()

https://allisonhorst.com/r-packages-functions

행 함수 1: filter()

행 함수 1: filter()

table1
# A tibble: 6 × 4
  country      year  cases population
  <chr>       <dbl>  <dbl>      <dbl>
1 Afghanistan  1999    745   19987071
2 Afghanistan  2000   2666   20595360
3 Brazil       1999  37737  172006362
4 Brazil       2000  80488  174504898
5 China        1999 212258 1272915272
6 China        2000 213766 1280428583
filter(table1, year == 2000)
# A tibble: 3 × 4
  country      year  cases population
  <chr>       <dbl>  <dbl>      <dbl>
1 Afghanistan  2000   2666   20595360
2 Brazil       2000  80488  174504898
3 China        2000 213766 1280428583
table1 |> 
  filter(
    year == 2000 & population > 50000000
  )
# A tibble: 2 × 4
  country  year  cases population
  <chr>   <dbl>  <dbl>      <dbl>
1 Brazil   2000  80488  174504898
2 China    2000 213766 1280428583

행 함수 2: arrange()

행 함수 2: arrange()

table1
# A tibble: 6 × 4
  country      year  cases population
  <chr>       <dbl>  <dbl>      <dbl>
1 Afghanistan  1999    745   19987071
2 Afghanistan  2000   2666   20595360
3 Brazil       1999  37737  172006362
4 Brazil       2000  80488  174504898
5 China        1999 212258 1272915272
6 China        2000 213766 1280428583
arrange(table1, cases)
# A tibble: 6 × 4
  country      year  cases population
  <chr>       <dbl>  <dbl>      <dbl>
1 Afghanistan  1999    745   19987071
2 Afghanistan  2000   2666   20595360
3 Brazil       1999  37737  172006362
4 Brazil       2000  80488  174504898
5 China        1999 212258 1272915272
6 China        2000 213766 1280428583
table1 |> 
  arrange(desc(cases))
# A tibble: 6 × 4
  country      year  cases population
  <chr>       <dbl>  <dbl>      <dbl>
1 China        2000 213766 1280428583
2 China        1999 212258 1272915272
3 Brazil       2000  80488  174504898
4 Brazil       1999  37737  172006362
5 Afghanistan  2000   2666   20595360
6 Afghanistan  1999    745   19987071

행 함수 3: distinct()

행 함수 3: distinct()

table1
# A tibble: 6 × 4
  country      year  cases population
  <chr>       <dbl>  <dbl>      <dbl>
1 Afghanistan  1999    745   19987071
2 Afghanistan  2000   2666   20595360
3 Brazil       1999  37737  172006362
4 Brazil       2000  80488  174504898
5 China        1999 212258 1272915272
6 China        2000 213766 1280428583
distinct(table1, country)
# A tibble: 3 × 1
  country    
  <chr>      
1 Afghanistan
2 Brazil     
3 China      
table1 |> 
  distinct(
    country, .keep_all = TRUE
  )
# A tibble: 3 × 4
  country      year  cases population
  <chr>       <dbl>  <dbl>      <dbl>
1 Afghanistan  1999    745   19987071
2 Brazil       1999  37737  172006362
3 China        1999 212258 1272915272

행 함수 4: slice()

행 함수 4: slice()

table1
# A tibble: 6 × 4
  country      year  cases population
  <chr>       <dbl>  <dbl>      <dbl>
1 Afghanistan  1999    745   19987071
2 Afghanistan  2000   2666   20595360
3 Brazil       1999  37737  172006362
4 Brazil       2000  80488  174504898
5 China        1999 212258 1272915272
6 China        2000 213766 1280428583
slice(table1, 2:3)
# A tibble: 2 × 4
  country      year cases population
  <chr>       <dbl> <dbl>      <dbl>
1 Afghanistan  2000  2666   20595360
2 Brazil       1999 37737  172006362
table1 |> 
  slice_head(n = 2)
# A tibble: 2 × 4
  country      year cases population
  <chr>       <dbl> <dbl>      <dbl>
1 Afghanistan  1999   745   19987071
2 Afghanistan  2000  2666   20595360
table1 |> 
  slice_tail(prop = 1/3)
# A tibble: 2 × 4
  country  year  cases population
  <chr>   <dbl>  <dbl>      <dbl>
1 China    1999 212258 1272915272
2 China    2000 213766 1280428583
table1 |> 
  slice_max(cases, n = 2)
# A tibble: 2 × 4
  country  year  cases population
  <chr>   <dbl>  <dbl>      <dbl>
1 China    2000 213766 1280428583
2 China    1999 212258 1272915272
table1 |> 
  slice_min(cases, prop = 1/3)
# A tibble: 2 × 4
  country      year cases population
  <chr>       <dbl> <dbl>      <dbl>
1 Afghanistan  1999   745   19987071
2 Afghanistan  2000  2666   20595360
table1 |> 
  slice_sample(n = 2, replace = TRUE)
# A tibble: 2 × 4
  country      year cases population
  <chr>       <dbl> <dbl>      <dbl>
1 Afghanistan  1999   745   19987071
2 Brazil       1999 37737  172006362

열 함수: 네 개의 주요 함수

  • select(): 변수(들) 중 일부를 추출

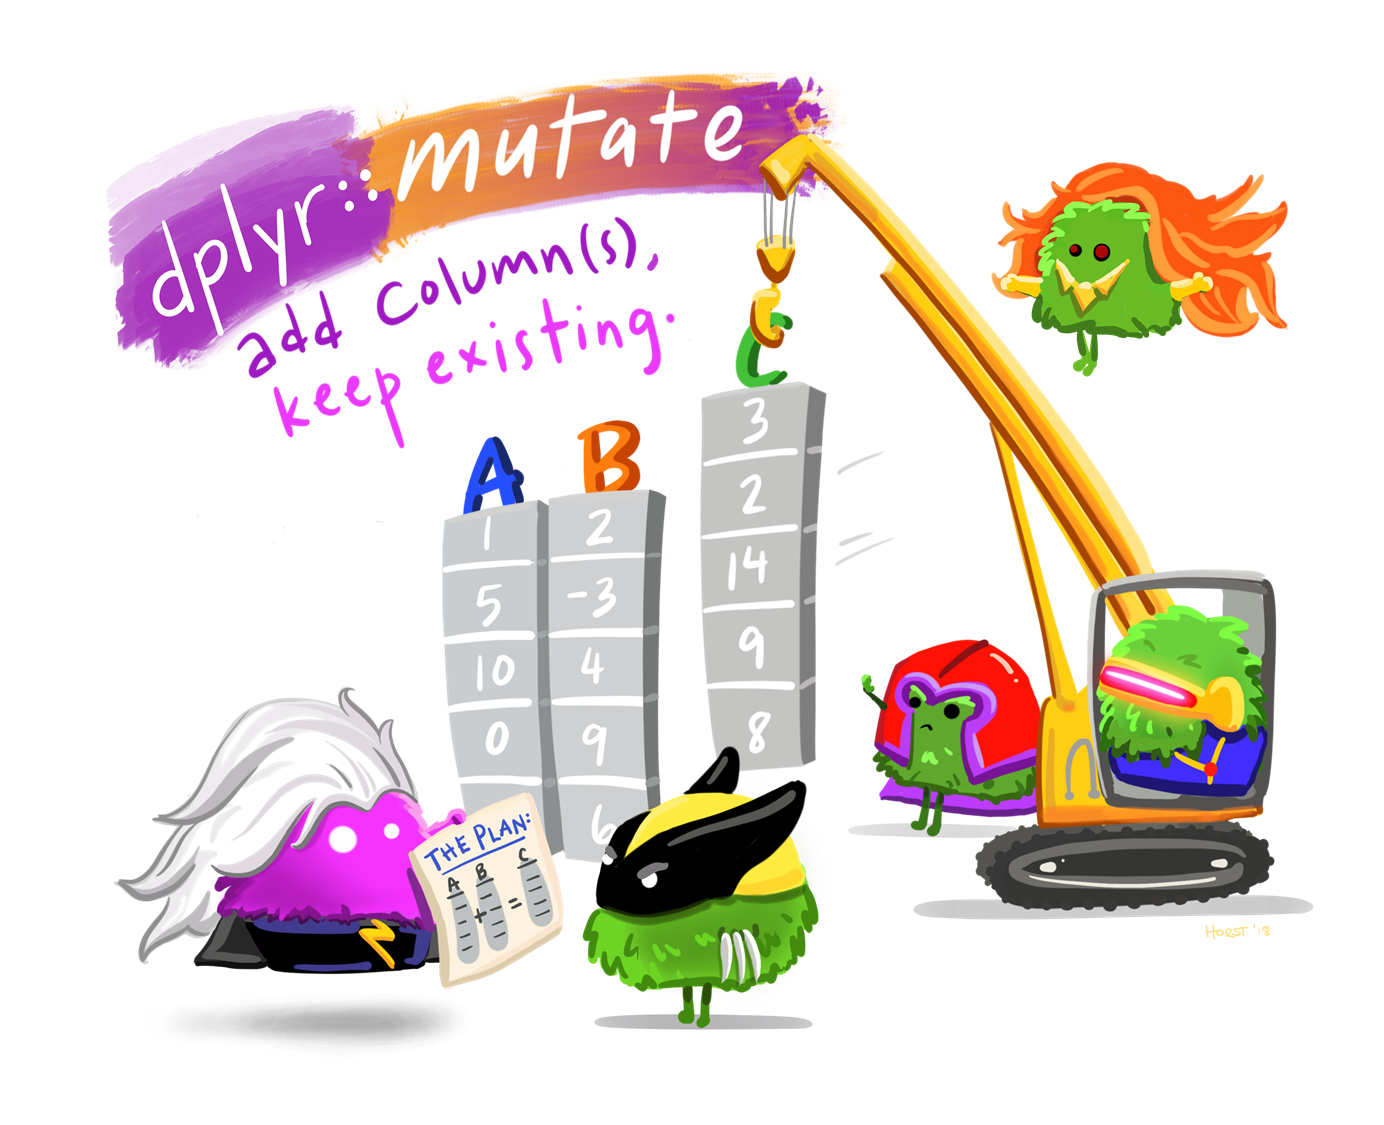
  • mutate(): 변수(들)를 변형해 새로운 변수를 생성

  • rename(): 변수(들)의 이름을 변경

  • relocate(): 변수(들)의 위치(순서)를 변경

열 함수 1: select()

열 함수 1: select()

table1
# A tibble: 6 × 4
  country      year  cases population
  <chr>       <dbl>  <dbl>      <dbl>
1 Afghanistan  1999    745   19987071
2 Afghanistan  2000   2666   20595360
3 Brazil       1999  37737  172006362
4 Brazil       2000  80488  174504898
5 China        1999 212258 1272915272
6 China        2000 213766 1280428583
select(table1, country, year)
# A tibble: 6 × 2
  country      year
  <chr>       <dbl>
1 Afghanistan  1999
2 Afghanistan  2000
3 Brazil       1999
4 Brazil       2000
5 China        1999
6 China        2000
table1 |> 
  select(-cases, -population)
# A tibble: 6 × 2
  country      year
  <chr>       <dbl>
1 Afghanistan  1999
2 Afghanistan  2000
3 Brazil       1999
4 Brazil       2000
5 China        1999
6 China        2000

열 함수 2: mutate()

https://allisonhorst.com/r-packages-functions

열 함수 2: mutate()

열 함수 2: mutate()

table1
# A tibble: 6 × 4
  country      year  cases population
  <chr>       <dbl>  <dbl>      <dbl>
1 Afghanistan  1999    745   19987071
2 Afghanistan  2000   2666   20595360
3 Brazil       1999  37737  172006362
4 Brazil       2000  80488  174504898
5 China        1999 212258 1272915272
6 China        2000 213766 1280428583
mutate(table1, rate = cases / population)
# A tibble: 6 × 5
  country      year  cases population      rate
  <chr>       <dbl>  <dbl>      <dbl>     <dbl>
1 Afghanistan  1999    745   19987071 0.0000373
2 Afghanistan  2000   2666   20595360 0.000129 
3 Brazil       1999  37737  172006362 0.000219 
4 Brazil       2000  80488  174504898 0.000461 
5 China        1999 212258 1272915272 0.000167 
6 China        2000 213766 1280428583 0.000167 
table1_new <- table1 |> 
  mutate(
    rate = cases / population,
    continent = if_else(country == "Brazil", "Americas", "Asia")
  )
table1_new
# A tibble: 6 × 6
  country      year  cases population      rate continent
  <chr>       <dbl>  <dbl>      <dbl>     <dbl> <chr>    
1 Afghanistan  1999    745   19987071 0.0000373 Asia     
2 Afghanistan  2000   2666   20595360 0.000129  Asia     
3 Brazil       1999  37737  172006362 0.000219  Americas 
4 Brazil       2000  80488  174504898 0.000461  Americas 
5 China        1999 212258 1272915272 0.000167  Asia     
6 China        2000 213766 1280428583 0.000167  Asia     

열 함수 3: rename()
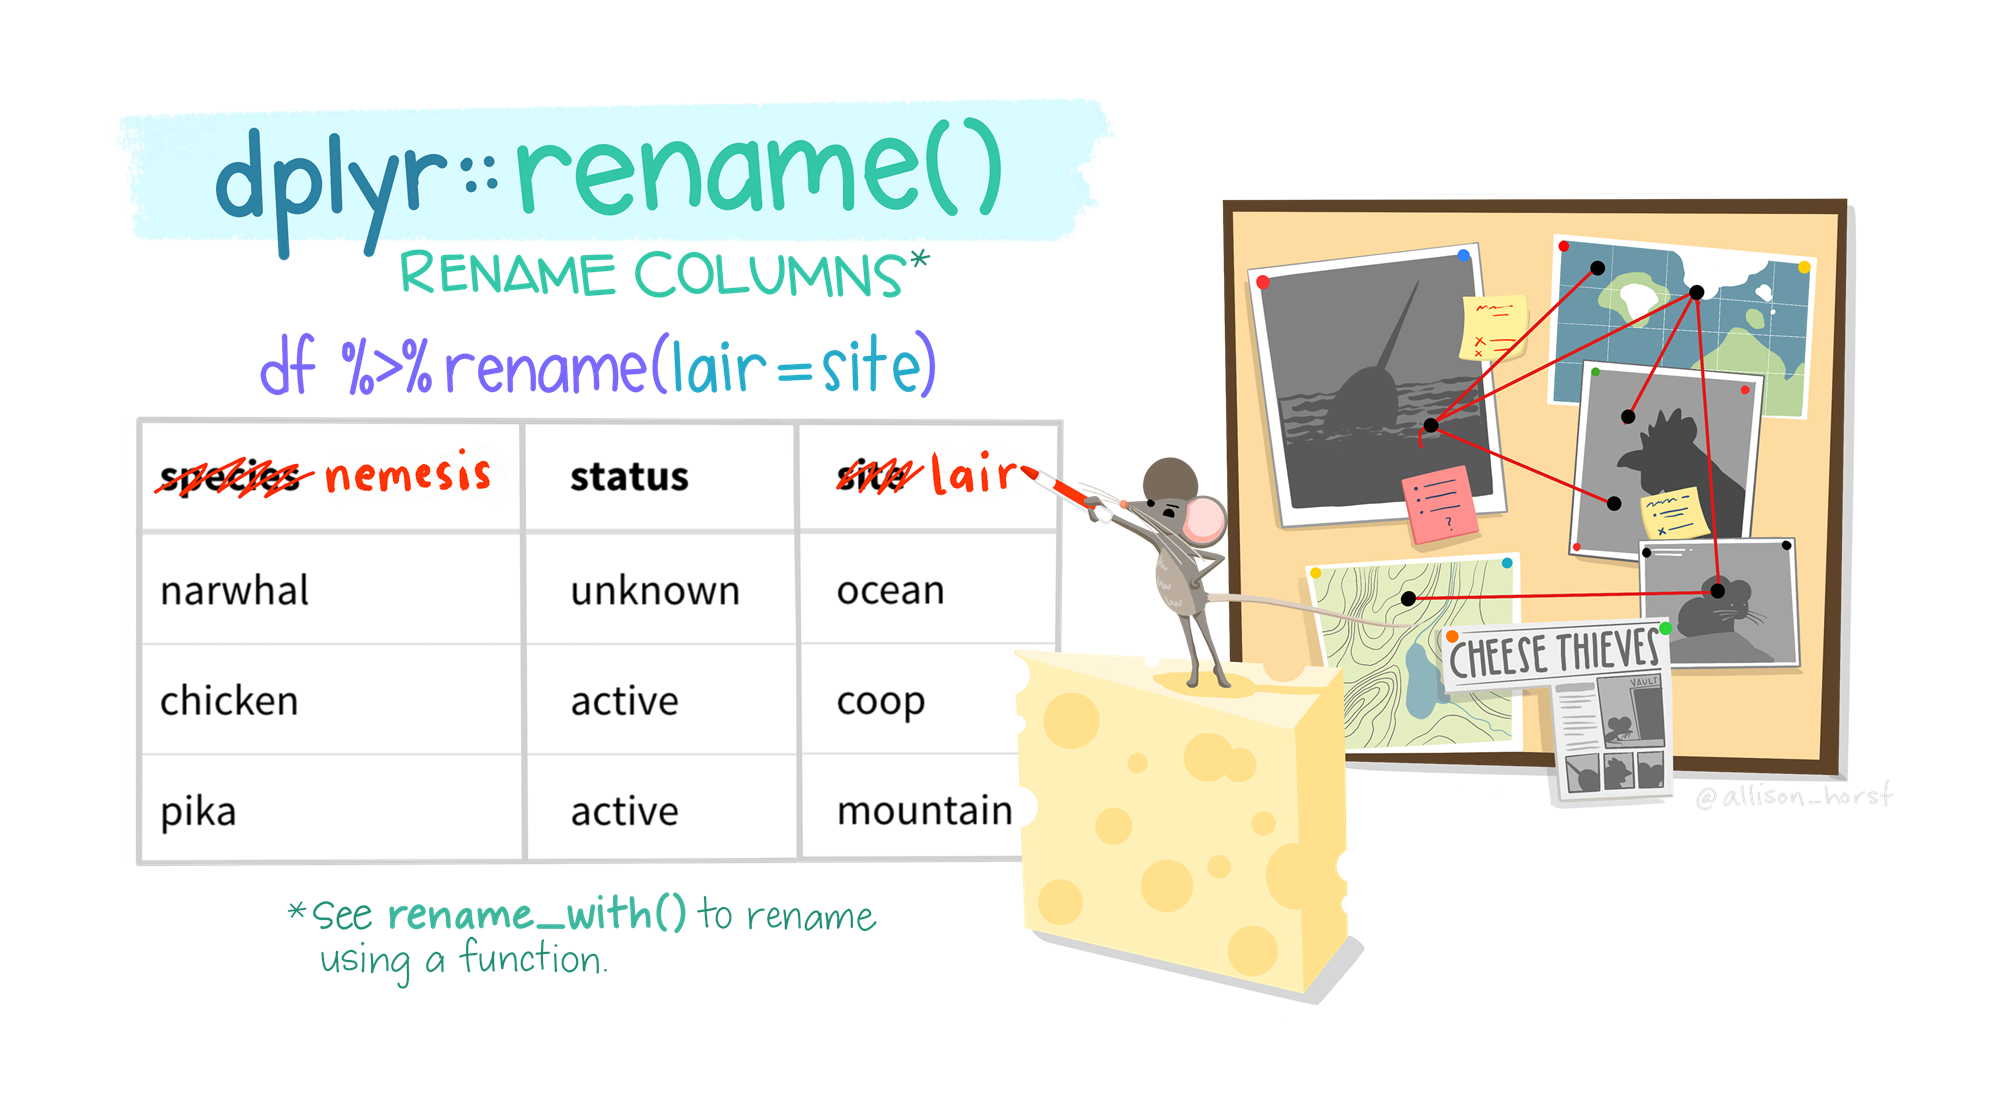
https://allisonhorst.com/r-packages-functions

열 함수 3: rename()

열 함수 3: rename()

table1_new
# A tibble: 6 × 6
  country      year  cases population      rate continent
  <chr>       <dbl>  <dbl>      <dbl>     <dbl> <chr>    
1 Afghanistan  1999    745   19987071 0.0000373 Asia     
2 Afghanistan  2000   2666   20595360 0.000129  Asia     
3 Brazil       1999  37737  172006362 0.000219  Americas 
4 Brazil       2000  80488  174504898 0.000461  Americas 
5 China        1999 212258 1272915272 0.000167  Asia     
6 China        2000 213766 1280428583 0.000167  Asia     
rename(table1_new, cont = continent)
# A tibble: 6 × 6
  country      year  cases population      rate cont    
  <chr>       <dbl>  <dbl>      <dbl>     <dbl> <chr>   
1 Afghanistan  1999    745   19987071 0.0000373 Asia    
2 Afghanistan  2000   2666   20595360 0.000129  Asia    
3 Brazil       1999  37737  172006362 0.000219  Americas
4 Brazil       2000  80488  174504898 0.000461  Americas
5 China        1999 212258 1272915272 0.000167  Asia    
6 China        2000 213766 1280428583 0.000167  Asia    
table1_new |> 
  rename(
    cont = continent,
    pop = population
  )
# A tibble: 6 × 6
  country      year  cases        pop      rate cont    
  <chr>       <dbl>  <dbl>      <dbl>     <dbl> <chr>   
1 Afghanistan  1999    745   19987071 0.0000373 Asia    
2 Afghanistan  2000   2666   20595360 0.000129  Asia    
3 Brazil       1999  37737  172006362 0.000219  Americas
4 Brazil       2000  80488  174504898 0.000461  Americas
5 China        1999 212258 1272915272 0.000167  Asia    
6 China        2000 213766 1280428583 0.000167  Asia    

열 함수 4: relocate()

https://allisonhorst.com/r-packages-functions

열 함수 4: relocate()

열 함수 4: relocate()

table1_new
# A tibble: 6 × 6
  country      year  cases population      rate continent
  <chr>       <dbl>  <dbl>      <dbl>     <dbl> <chr>    
1 Afghanistan  1999    745   19987071 0.0000373 Asia     
2 Afghanistan  2000   2666   20595360 0.000129  Asia     
3 Brazil       1999  37737  172006362 0.000219  Americas 
4 Brazil       2000  80488  174504898 0.000461  Americas 
5 China        1999 212258 1272915272 0.000167  Asia     
6 China        2000 213766 1280428583 0.000167  Asia     
relocate(table1_new, year, continent)
# A tibble: 6 × 6
   year continent country      cases population      rate
  <dbl> <chr>     <chr>        <dbl>      <dbl>     <dbl>
1  1999 Asia      Afghanistan    745   19987071 0.0000373
2  2000 Asia      Afghanistan   2666   20595360 0.000129 
3  1999 Americas  Brazil       37737  172006362 0.000219 
4  2000 Americas  Brazil       80488  174504898 0.000461 
5  1999 Asia      China       212258 1272915272 0.000167 
6  2000 Asia      China       213766 1280428583 0.000167 
table1_new |> 
  relocate(
    rate,
    .before = year
  )
# A tibble: 6 × 6
  country          rate  year  cases population continent
  <chr>           <dbl> <dbl>  <dbl>      <dbl> <chr>    
1 Afghanistan 0.0000373  1999    745   19987071 Asia     
2 Afghanistan 0.000129   2000   2666   20595360 Asia     
3 Brazil      0.000219   1999  37737  172006362 Americas 
4 Brazil      0.000461   2000  80488  174504898 Americas 
5 China       0.000167   1999 212258 1272915272 Asia     
6 China       0.000167   2000 213766 1280428583 Asia     

그룹 함수: 네 개의 주요 함수

  • group_by(): 변수(들)에 의거해 전체 행(들)을 그룹으로 분할

  • summarize(): 그룹별로 변수(들)의 통계량을 산출하여 새로운 변수(들)로 저장

  • count(): 그룹별로 해당 관측개체의 빈도수를 계산

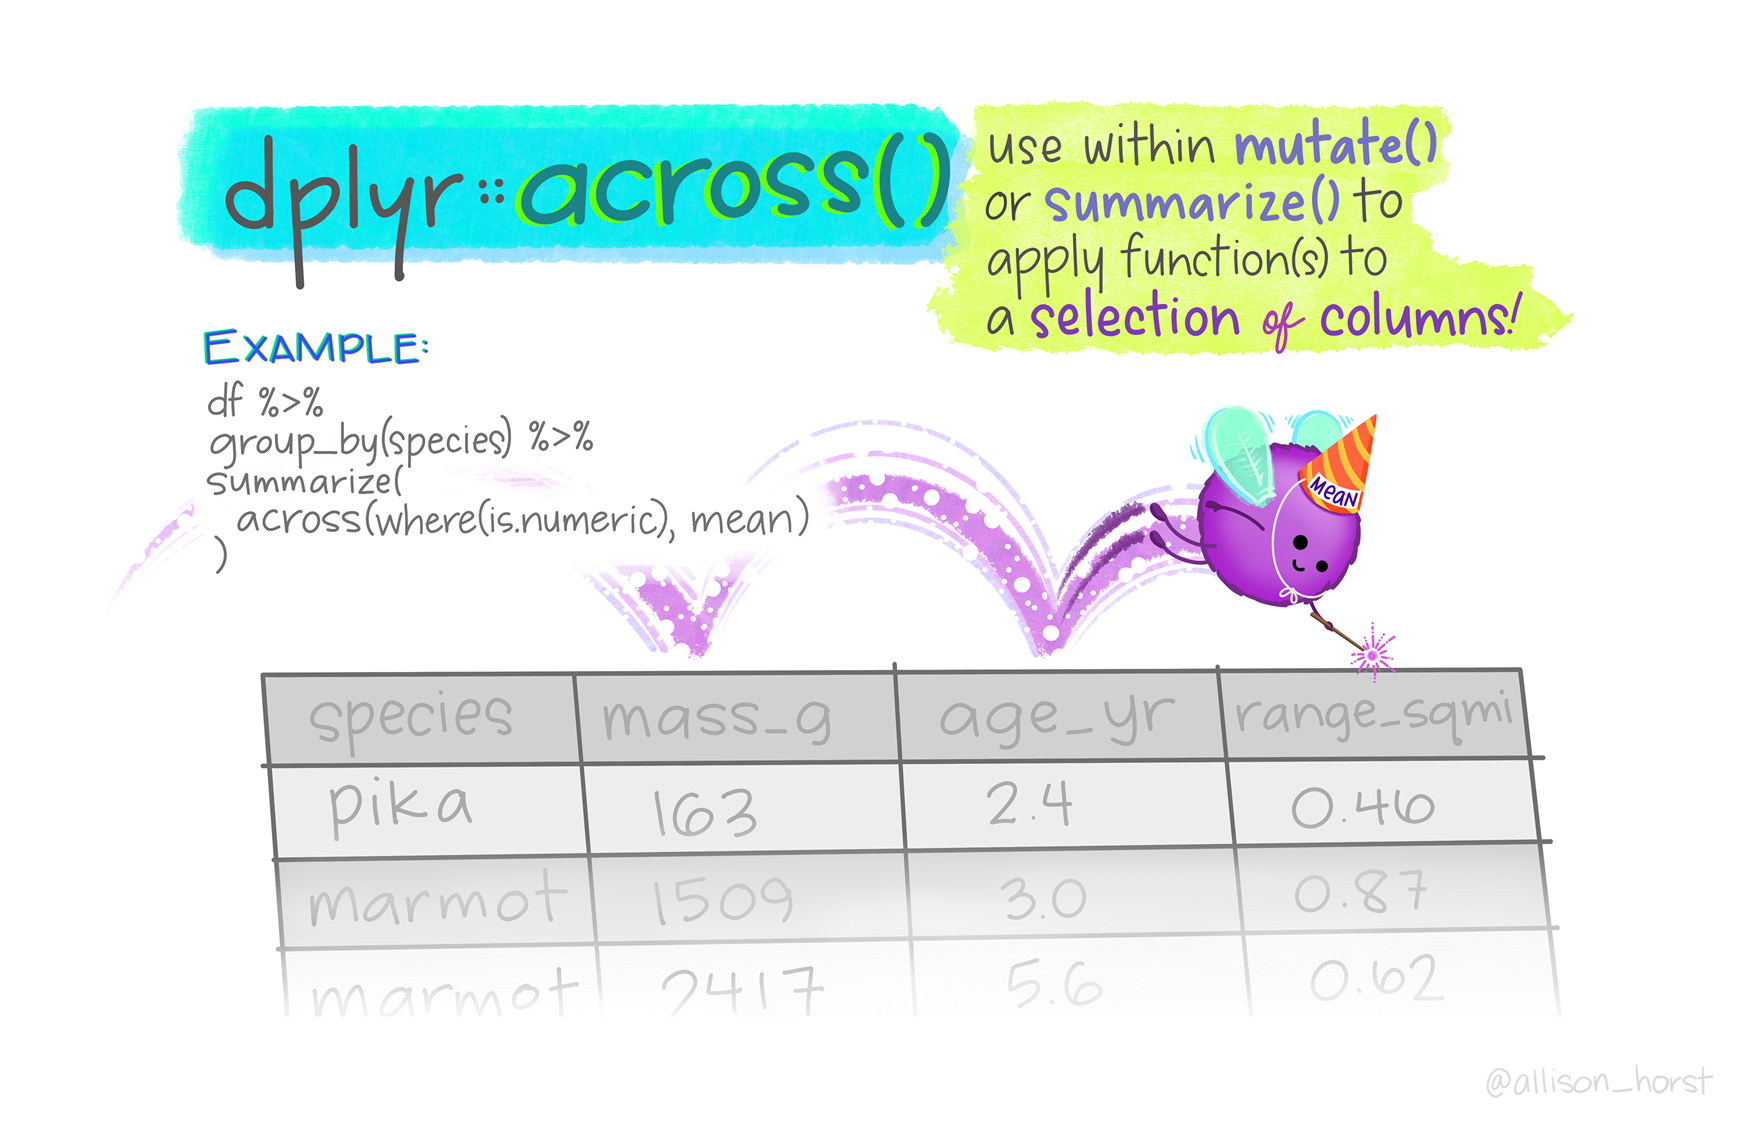
  • across(): 그룹별로 여러 변수에 걸쳐 동일한 통계량을 산출하고 새로운 변수들로 저장

그룹 함수 1: group_by()
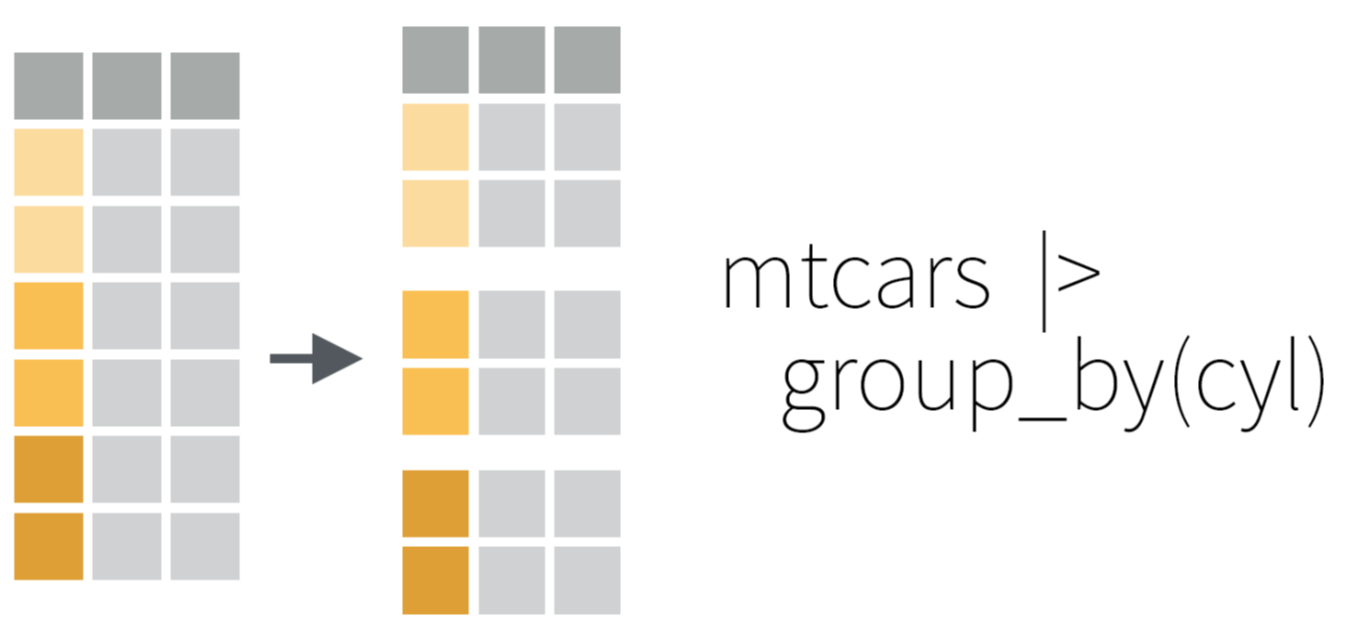
그룹 함수 1: group_by()

table1_new
# A tibble: 6 × 6
  country      year  cases population      rate continent
  <chr>       <dbl>  <dbl>      <dbl>     <dbl> <chr>    
1 Afghanistan  1999    745   19987071 0.0000373 Asia     
2 Afghanistan  2000   2666   20595360 0.000129  Asia     
3 Brazil       1999  37737  172006362 0.000219  Americas 
4 Brazil       2000  80488  174504898 0.000461  Americas 
5 China        1999 212258 1272915272 0.000167  Asia     
6 China        2000 213766 1280428583 0.000167  Asia     
group_by(table1_new, continent)
# A tibble: 6 × 6
# Groups:   continent [2]
  country      year  cases population      rate continent
  <chr>       <dbl>  <dbl>      <dbl>     <dbl> <chr>    
1 Afghanistan  1999    745   19987071 0.0000373 Asia     
2 Afghanistan  2000   2666   20595360 0.000129  Asia     
3 Brazil       1999  37737  172006362 0.000219  Americas 
4 Brazil       2000  80488  174504898 0.000461  Americas 
5 China        1999 212258 1272915272 0.000167  Asia     
6 China        2000 213766 1280428583 0.000167  Asia     
table1_new |> 
  group_by(continent, year)
# A tibble: 6 × 6
# Groups:   continent, year [4]
  country      year  cases population      rate continent
  <chr>       <dbl>  <dbl>      <dbl>     <dbl> <chr>    
1 Afghanistan  1999    745   19987071 0.0000373 Asia     
2 Afghanistan  2000   2666   20595360 0.000129  Asia     
3 Brazil       1999  37737  172006362 0.000219  Americas 
4 Brazil       2000  80488  174504898 0.000461  Americas 
5 China        1999 212258 1272915272 0.000167  Asia     
6 China        2000 213766 1280428583 0.000167  Asia     

그룹 함수 2: summarize()

그룹 함수 2: summarize()

table1_new
# A tibble: 6 × 6
  country      year  cases population      rate continent
  <chr>       <dbl>  <dbl>      <dbl>     <dbl> <chr>    
1 Afghanistan  1999    745   19987071 0.0000373 Asia     
2 Afghanistan  2000   2666   20595360 0.000129  Asia     
3 Brazil       1999  37737  172006362 0.000219  Americas 
4 Brazil       2000  80488  174504898 0.000461  Americas 
5 China        1999 212258 1272915272 0.000167  Asia     
6 China        2000 213766 1280428583 0.000167  Asia     
summarize(table1_new, 
  sum_cases = sum(cases)
  )
# A tibble: 1 × 1
  sum_cases
      <dbl>
1    547660
table1_new |> 
  summarize(
    sum_cases = sum(cases), 
    mean_rate = mean(rate)
  )
# A tibble: 1 × 2
  sum_cases mean_rate
      <dbl>     <dbl>
1    547660  0.000197

그룹 함수 1 + 2: group_by() + summarize()

그룹 함수 1 + 2: group_by() + summarize()

table1_new
# A tibble: 6 × 6
  country      year  cases population      rate continent
  <chr>       <dbl>  <dbl>      <dbl>     <dbl> <chr>    
1 Afghanistan  1999    745   19987071 0.0000373 Asia     
2 Afghanistan  2000   2666   20595360 0.000129  Asia     
3 Brazil       1999  37737  172006362 0.000219  Americas 
4 Brazil       2000  80488  174504898 0.000461  Americas 
5 China        1999 212258 1272915272 0.000167  Asia     
6 China        2000 213766 1280428583 0.000167  Asia     
table1_new_group <- group_by(table1_new, continent, year)
summarize(table1_new_group, 
  sum_cases = sum(cases),
  mean_rate = mean(rate)
  )
# A tibble: 4 × 4
# Groups:   continent [2]
  continent  year sum_cases mean_rate
  <chr>     <dbl>     <dbl>     <dbl>
1 Americas   1999     37737  0.000219
2 Americas   2000     80488  0.000461
3 Asia       1999    213003  0.000102
4 Asia       2000    216432  0.000148
table1_new |> 
  group_by(continent, year) |> 
  summarize(
    sum_cases = sum(cases), 
    sum_pop = sum(population)
  ) |> 
  mutate(
    rate = sum_cases / sum_pop
  ) |> 
  ungroup()
# A tibble: 4 × 5
  continent  year sum_cases    sum_pop     rate
  <chr>     <dbl>     <dbl>      <dbl>    <dbl>
1 Americas   1999     37737  172006362 0.000219
2 Americas   2000     80488  174504898 0.000461
3 Asia       1999    213003 1292902343 0.000165
4 Asia       2000    216432 1301023943 0.000166

그룹 함수 3: count()

그룹 함수 3: count()

table1_new
# A tibble: 6 × 6
  country      year  cases population      rate continent
  <chr>       <dbl>  <dbl>      <dbl>     <dbl> <chr>    
1 Afghanistan  1999    745   19987071 0.0000373 Asia     
2 Afghanistan  2000   2666   20595360 0.000129  Asia     
3 Brazil       1999  37737  172006362 0.000219  Americas 
4 Brazil       2000  80488  174504898 0.000461  Americas 
5 China        1999 212258 1272915272 0.000167  Asia     
6 China        2000 213766 1280428583 0.000167  Asia     
count(table1_new, year, continent)
# A tibble: 4 × 3
   year continent     n
  <dbl> <chr>     <int>
1  1999 Americas      1
2  1999 Asia          2
3  2000 Americas      1
4  2000 Asia          2
table1_new |> 
  count(year, continent, wt = cases)
# A tibble: 4 × 3
   year continent      n
  <dbl> <chr>      <dbl>
1  1999 Americas   37737
2  1999 Asia      213003
3  2000 Americas   80488
4  2000 Asia      216432
table1_new |> 
  group_by(year, continent) |> 
  summarize(
    cases_n = n(),
    cases_sum = sum(cases)
  )
# A tibble: 4 × 4
# Groups:   year [2]
   year continent cases_n cases_sum
  <dbl> <chr>       <int>     <dbl>
1  1999 Americas        1     37737
2  1999 Asia            2    213003
3  2000 Americas        1     80488
4  2000 Asia            2    216432

그룹 함수 4: across()

https://allisonhorst.com/r-packages-functions

그룹 함수 4: across()

table1_new
# A tibble: 6 × 6
  country      year  cases population      rate continent
  <chr>       <dbl>  <dbl>      <dbl>     <dbl> <chr>    
1 Afghanistan  1999    745   19987071 0.0000373 Asia     
2 Afghanistan  2000   2666   20595360 0.000129  Asia     
3 Brazil       1999  37737  172006362 0.000219  Americas 
4 Brazil       2000  80488  174504898 0.000461  Americas 
5 China        1999 212258 1272915272 0.000167  Asia     
6 China        2000 213766 1280428583 0.000167  Asia     
summarize(table1_new, across(c(cases, population), mean))
# A tibble: 1 × 2
   cases population
   <dbl>      <dbl>
1 91277. 490072924.
table1_new |> 
  group_by(year) |> 
  summarize(
    across(
      c(cases, population, rate),
      mean,
      .names = "mean_{.col}"
    )
  )
# A tibble: 2 × 4
   year mean_cases mean_population mean_rate
  <dbl>      <dbl>           <dbl>     <dbl>
1  1999     83580       488302902.  0.000141
2  2000     98973.      491842947   0.000253

파이프 연산자와 dplyr 함수

https://www.rforecology.com/post/how-to-use-pipes/

파이프 연산자와 dplyr 함수

https://r4ds.hadley.nz/data-transform

파이프 연산자와 dplyr 함수

library(tidyverse)
library(nycflights13)
flights1 <- filter(flights, dest == "IAH")
flights2 <- mutate(flights1, speed = distance / air_time * 60)
flights3 <- select(flights2, year:day, dep_time, carrier, flight, speed)
arrange(flights3, desc(speed))
arrange(
  select(
    mutate(
      filter(
        flights, 
        dest == "IAH"
      ),
      speed = distance / air_time * 60
    ),
    year:day, dep_time, carrier, flight, speed
  ),
  desc(speed)
)
flights |> 
  filter(dest == "IAH") |> 
  mutate(
    speed = distance / air_time * 60
  ) |> 
  select(
    year:day, dep_time, carrier, flight, speed
  ) |> 
  arrange(desc(speed))
flights |> 
  filter(dest == "IAH") |> 
  mutate(speed = distance / air_time * 60) |> 
  select(year:day, dep_time, carrier, flight, speed) |> 
  arrange(desc(speed))
# A tibble: 7,198 × 7
    year month   day dep_time carrier flight speed
   <int> <int> <int>    <int> <chr>    <int> <dbl>
 1  2013     7     9      707 UA         226  522.
 2  2013     8    27     1850 UA        1128  521.
 3  2013     8    28      902 UA        1711  519.
 4  2013     8    28     2122 UA        1022  519.
 5  2013     6    11     1628 UA        1178  515.
 6  2013     8    27     1017 UA         333  515.
 7  2013     8    27     1205 UA        1421  515.
 8  2013     8    27     1758 UA         302  515.
 9  2013     9    27      521 UA         252  515.
10  2013     8    28      625 UA         559  515.
# ℹ 7,188 more rows

파이프 연산자와 dplyr 함수

https://info5940.infosci.cornell.edu/slides/pipes-and-functions-in-r/#9

데이터 시각화하기

ggplot2 패키지

https://ggplot2.tidyverse.org/

ggplot2 패키지: 탐색의 도구

https://allisonhorst.com/allison-horst

ggplot2 패키지: 커뮤니케이션의 도구

https://allisonhorst.com/allison-horst

Grammar of graphics

ggplot2의 8대 구성 요소

https://initiation.doana-r.com/06-ggplot2#1

심미성과 기하

  • 심미성(aesthetics) 혹은 심미성 매핑(aesthetic mapping)

    • 그래프의 외견을 규정

    • 심미성의 요소(시각 변수 혹은 속성): 시각적 다양성의 원천

      • x-축, y-축, color, size, linewidth, shape, alpha 등
    • 심미성 매핑: 특정한 심미성 요소를 특정한 변수에 부여하는 과정

    • aes()

  • 기하(geometries) 혹은 기하 객체(geometric objects)

    • 그래프의 전체 구조 혹은 형식을 규정

    • 그래프의 유형: bar chart, line chart 등

    • geom_

심미성과 기하

gapminder |> 
  filter(year == 2007) |> 
  ggplot(aes(x = gdpPercap, y = lifeExp)) +
  geom_point(aes(color = continent)) +
  geom_smooth(color = "black")

심미성과 기하

  • x-axis, y-axis

  • color, fill

  • shape

  • size

  • linewidth, linetype

  • alpha

  • geom_point()

  • geom_line()

  • geom_bar(), geom_col()

  • geom_histogram(), geom_density()

  • geom_smooth()

  • geom_boxplot(), geom_violin()

  • geom_text(), geom_label()

  • geom_sf()

스케일 scale

  • 심미성의 구체적 구현

  • x-axis, y-axis

    • scale_x_continuous(), scale_x_discrete()
    • scale_y_continuous(), scale_y_discrete()
  • color와 fill

    • scale_color_brewer(), scale_fill_brewer()
    • scale_color_manual(), scale_fill_manual()
  • others

    • scale_shape(), scale_size()

    • scale_linetype(), scale_linewidth()

패싯 facet

  • 다면생성(faceting) 과정을 통해, 하나의 플롯을 여러 개의 하위 플롯으로 분할

  • 두 가지 중요 함수

    • facet_wrap()

    • facet_grid()

패싯 facet

gapminder |> 
  filter(year == 2007) |> 
  ggplot(aes(x = log(gdpPercap), y = log(lifeExp))) +
  geom_point(aes(size = pop)) +
  geom_smooth()

gapminder |> 
  filter(year == 2007) |> 
  ggplot(aes(x = log(gdpPercap), y = log(lifeExp))) +
  geom_point(aes(size = pop)) +
  geom_smooth() +
  facet_wrap(~continent)

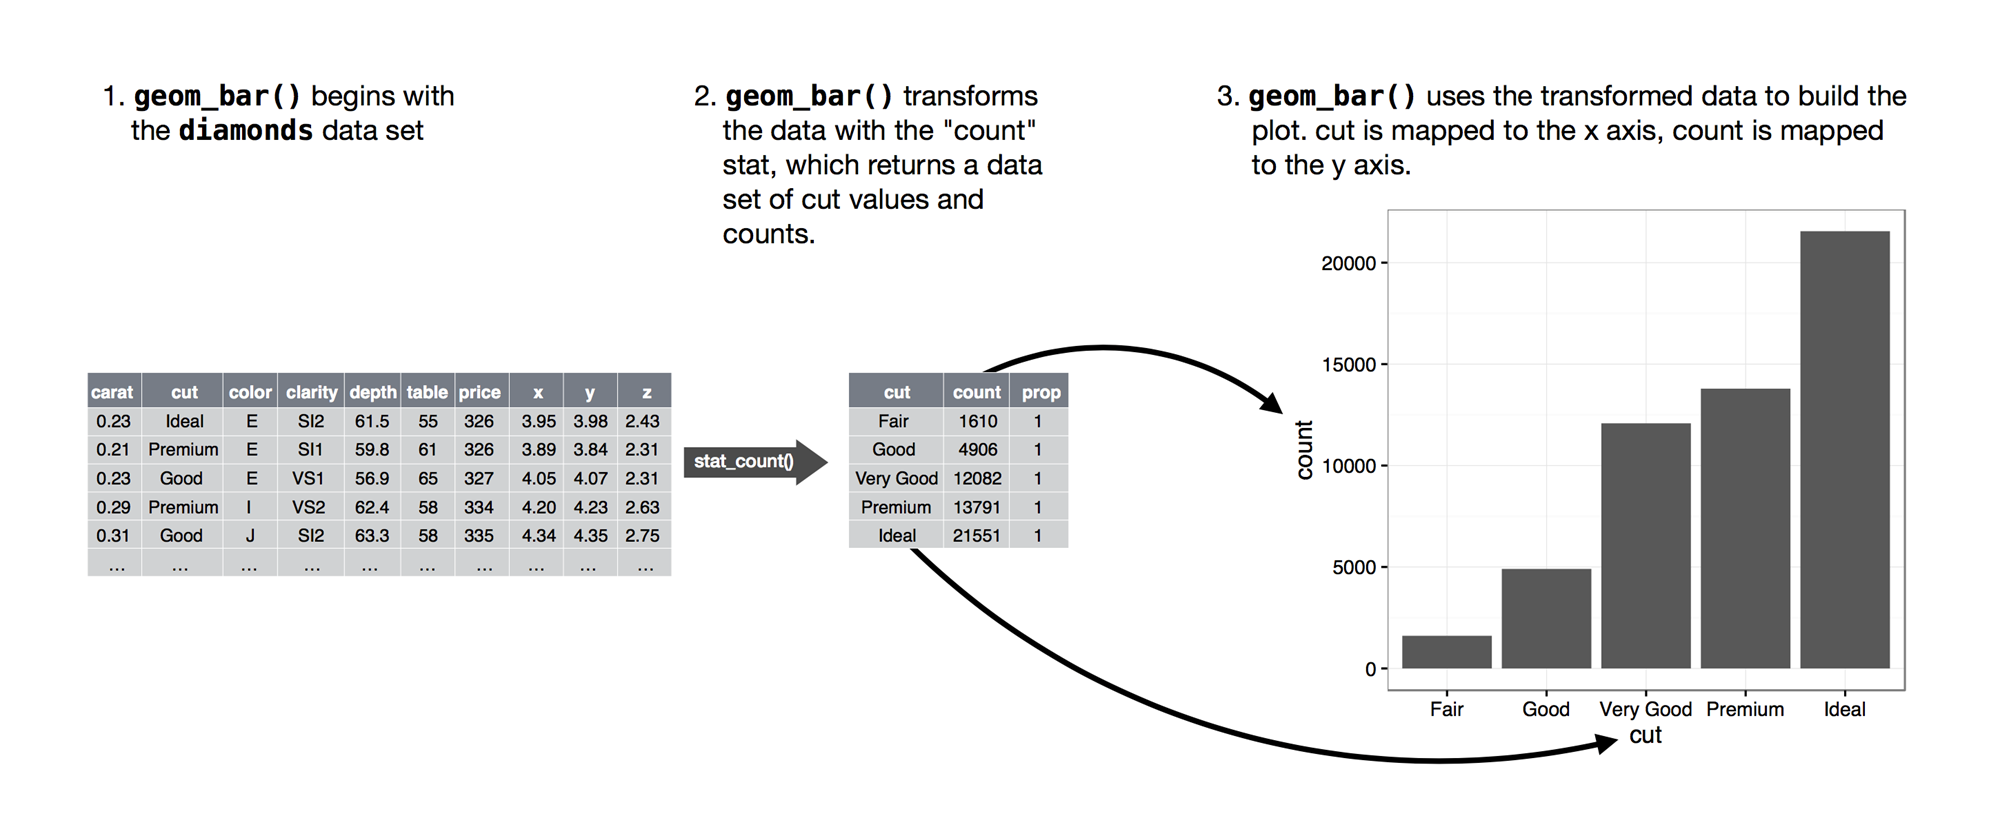
통계적 변환 Statistical transformation

https://r4ds.hadley.nz/layers

좌표 Coordinates

  • 그래픽 요소들의 위치 결정에 기준이 되는 준거 체계

  • 두 가지 중요 함수

    • coord_flip()

    • coord_fixed()

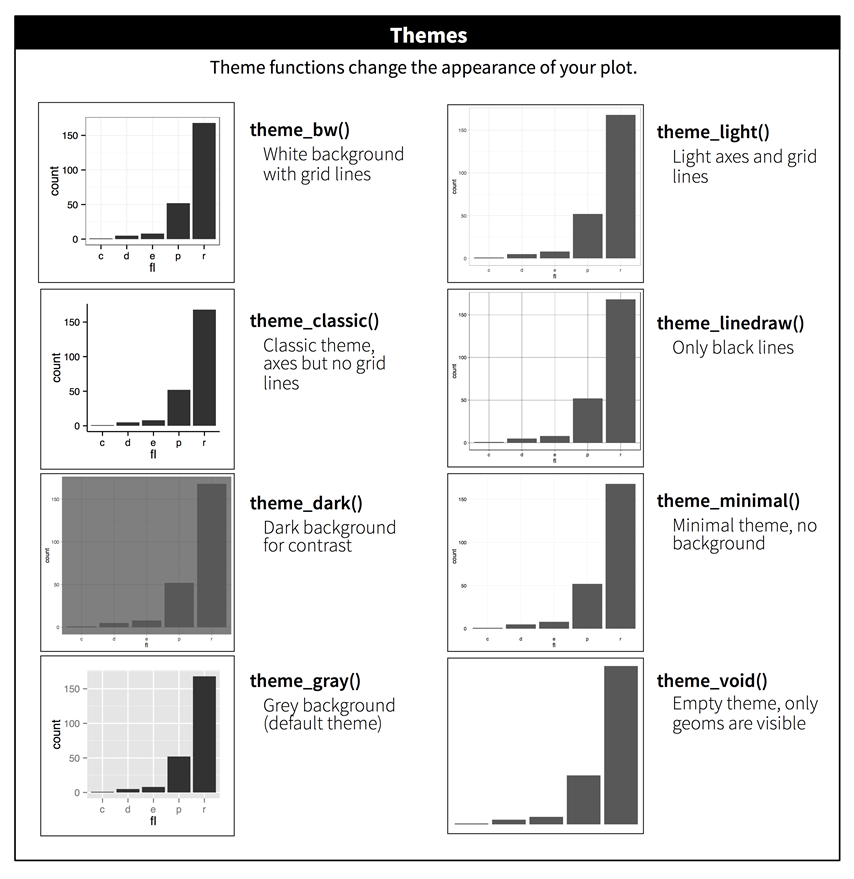
테마 Theme

  • 그래프의 전체적인 외양(테마)를 수정

    • 8개 테마 제공
  • 그래프의 세부 구성 요소를 수정

    • theme()

테마 Theme

https://r4ds.hadley.nz/communication

테마 Theme

ggplot2 익스텐션 Extensions

https://exts.ggplot2.tidyverse.org/

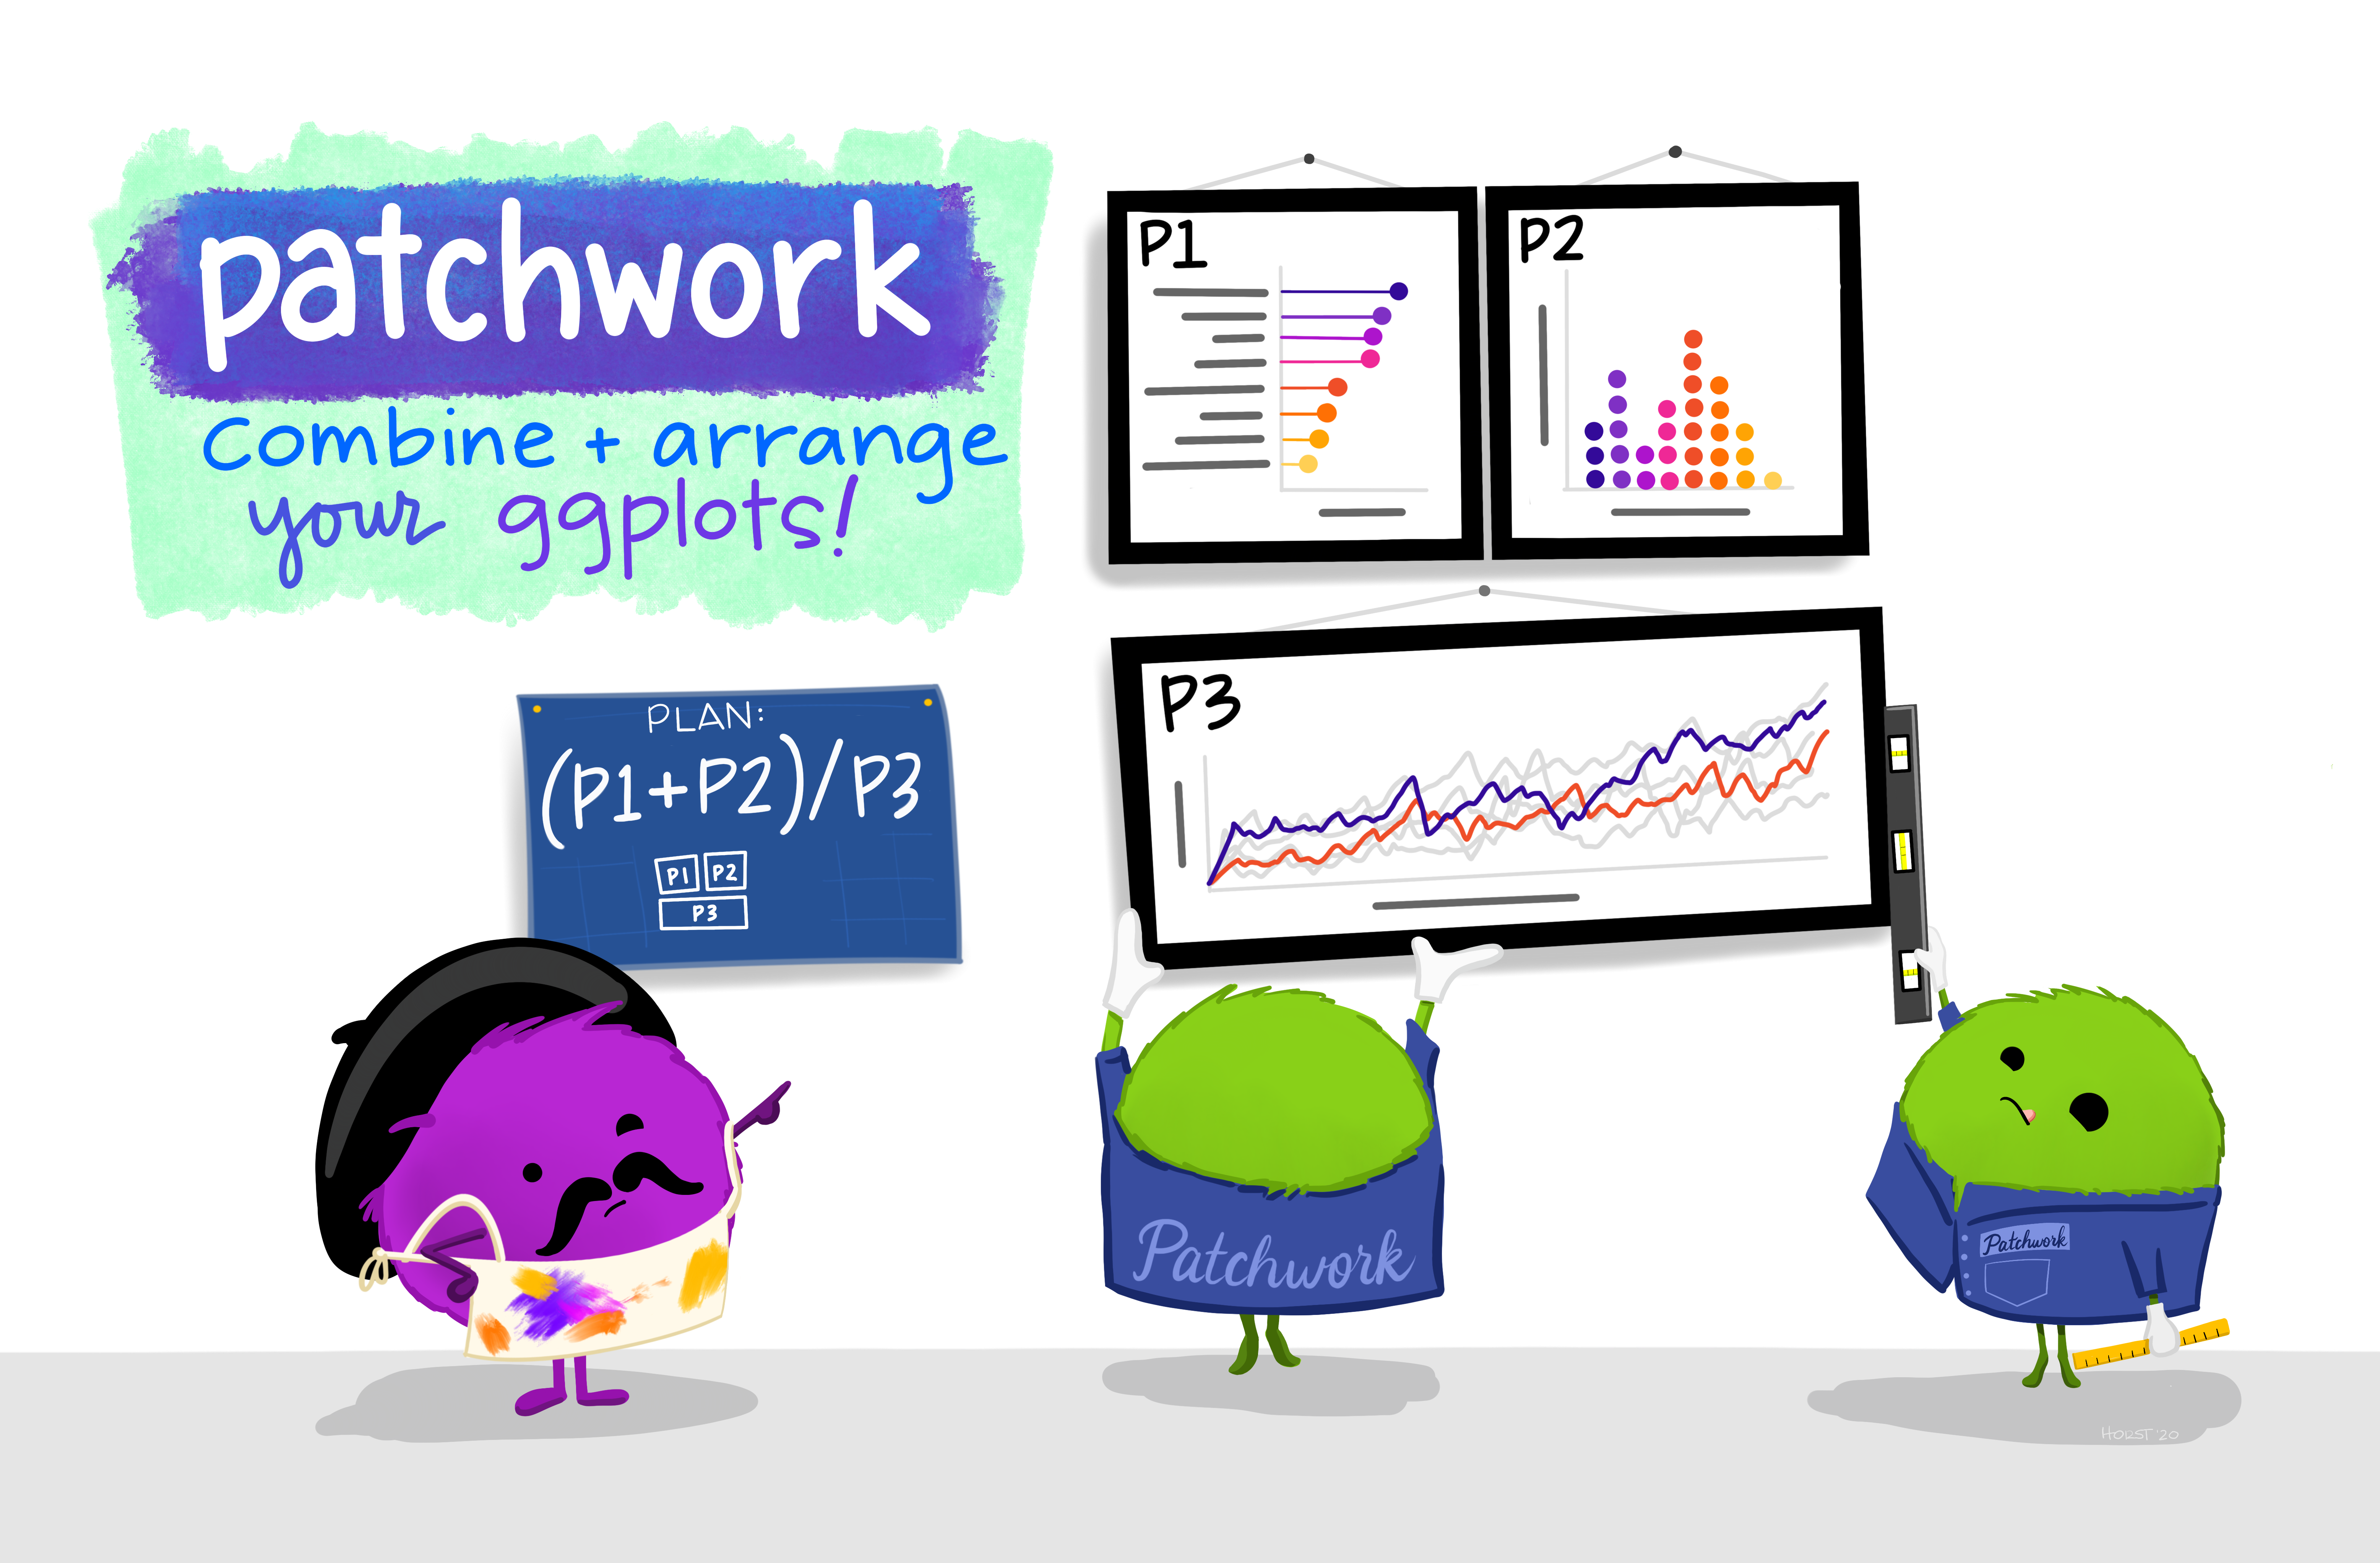
patchwork 패키지

https://allisonhorst.com/r-packages-functions

gganimate 패키지

https://allisonhorst.com/r-packages-functions

ggrepel 패키지